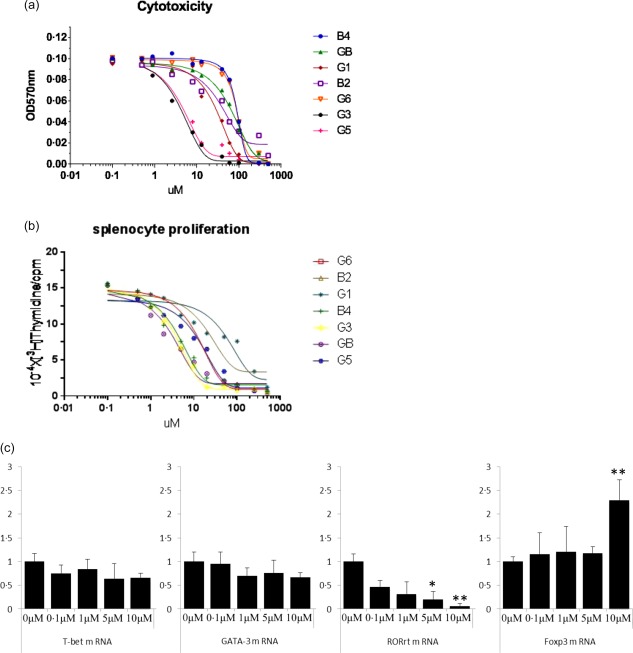
Figure 2.

(a) Cytotoxicity profile of the drugs toward splenocytes. For cell viability measurements, BALB/c splenocytes were cultured with increasing concentrations of drugs for 48 h. The results represent the means ± standard error of the means (s.e.m.). (b) Effects of the drugs on the concanavalin A (ConA)‐induced proliferation profile of splenocytes. For the proliferation assay, BALB/c splenocytes were stimulated with ConA for 48 h at increasing concentrations of drugs in a 96‐well plate in triplicate. The results represent the means ± s.e.m. (c) B2 inhibits CD4+ T cell differentiation. Naive CD4+ T cells isolated from mice were cultured under the appropriate polarizing conditions in the presence of B2 for 4 days. Total RNA was isolated from the cells, and quantitative real‐time polymerase chain reaction (qRT–PCR) was performed to measure the mRNA levels of T cell lineage‐specific master transcription factors. The results represent the means of three independent experiments. *P < 0·001 and **P < 0·05 versus the differentiated group. [Colour figure can be viewed at wileyonlinelibrary.com]
