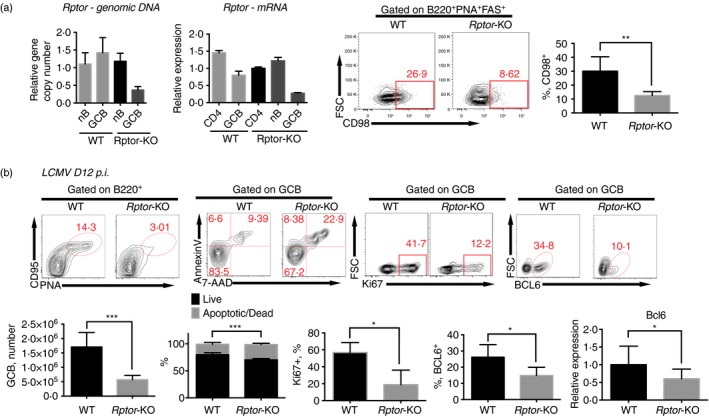
Figure 1.

Mammalian target of rapamycin complex 1 (mTORC1) signalling sustains B‐cell responses to lymphocytic choriomeningitis virus (LCMV) infection. (a) Quantification of Rptor genomic DNA (left) and mRNA (middle left) copy number by quantitative PCR in sorted lymphocytes as indicated; staining of CD98 in germinal centre B (GCB) (PNA + CD95+ B220+) cells (middle right) and frequency of CD98+ population in GCB cells (right) from wild‐type C57BL/6J (WT) and Aicda‐Cre‐Rptor flox (Rptor‐KO) mice 8 days after infection with the Armstrong strain of LCMV. (b) Flow cytometry of B220+ B cells (top, left) and PNA + CD95+ B220+ GCB cells (top, middle and right); and quantification of PNA + CD95+ B220+ GCB cell number, apoptotic/dead cell frequency, Ki67+ frequency and BCL6+ frequency in PNA + CD95+ B220+ GCB cells (bottom, left, middle left and middle) in spleens from WT and Rptor‐KO mice on day 12 after LCMV infection. Quantification of frequency and total number per spleen of indicated subsets and quantification of Bcl6 mRNA in GCB cells in the indicated mice (bottom middle right and right). *P < 0·05 **P < 0·005 ***P < 0·002 (unpaired two‐tailed t‐test). Data are representative of three independent experiments with three to six mice per group (error bars, SEM). [Colour figure can be viewed at wileyonlinelibrary.com]
