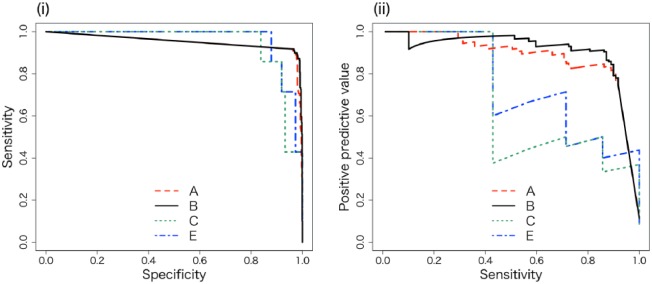
Figure 3.
(i) ROC curves of algorithms (A), (B), (C), and (E). (ii) The PS curves of the algorithms. We drew PS curves and evaluated whether the PPV maintained a high score while retaining a high sensitivity. The axes of the ROC curve consist of specificity = (1 – (TN / (FP + TN))) and sensitivity = (TP / (TP + FN)). The axes of the PS curve consist of precision = PPV and sensitivity, where TN = true negative, FP = false positive, TP = true positive, and FN = false negative.

