Figure 3.

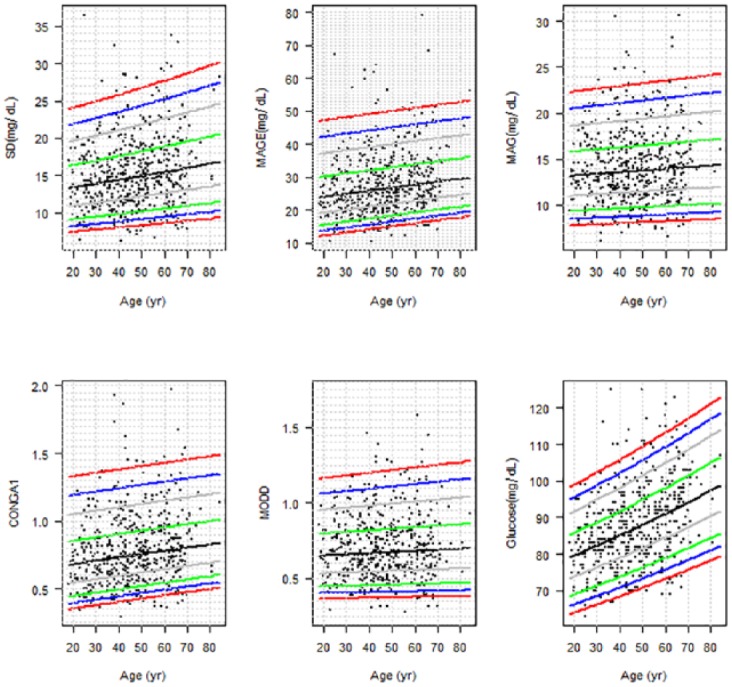
Percentile curves (2.5, 5, 10, 25, 50, 75, 90, 95, 97.5) for glycemic variability indices (SD, MAGE, MAG, CONGA1, and MODD) and fasting glucose levels in the population without diabetes.

Percentile curves (2.5, 5, 10, 25, 50, 75, 90, 95, 97.5) for glycemic variability indices (SD, MAGE, MAG, CONGA1, and MODD) and fasting glucose levels in the population without diabetes.