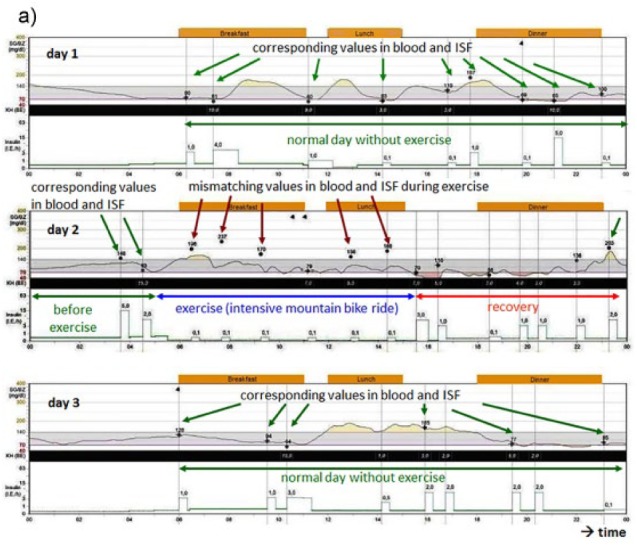
Figure 1a.

Differences in glucose excursions in ISF monitored by a glucose sensor and blood glucose measurements before (day 1, upper graph), during (day 2, middle graph), and after (day 3, lower graph) a cycling marathon (day 2). During physical activity, the differences in the glucose values measured in blood (black dots, red arrows) and the black line (representing ISF values measured by a CGM system) are higher than on the other days with normal physical activity (green arrows) and low glucose dynamics. The most probable explanation is the pronounced and quick glucose utilization during the marathon.7 These effects can get visible when carbohydrates are resorbed.
