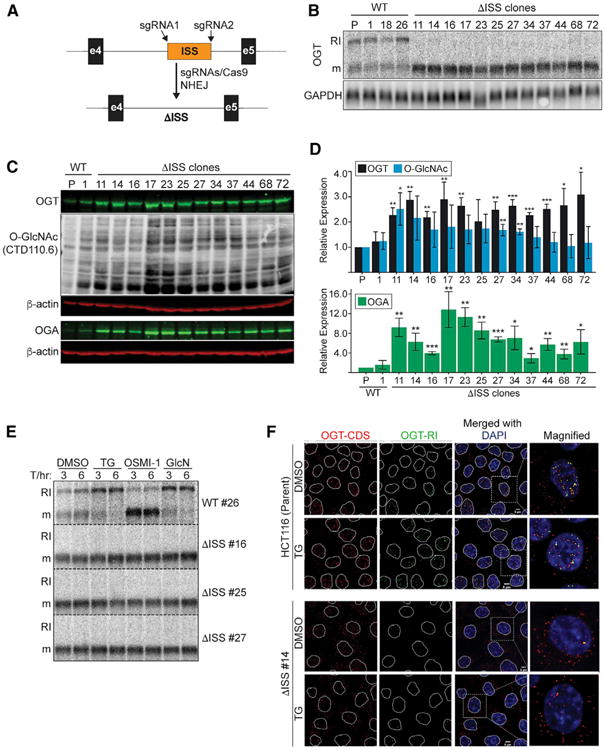
Figure 4. The ISS Is Necessary for Basal and Induced OGT Intron Retention.

(A) CRISPR genomic deletion strategy.
(B) Northern blot using RNA from clonal wild-type and ΔISS CRISPR lines. The lane marked “P” is the parental, HCT116 line.
(C) Representative western blots of parental, wild-type #1, and all 12 ISS-deletion clones. The top three panels (OGT, O-GlcNAc, and β-actin) were the same blot, and the bottom two panels were a separate blot with the same samples.
(D) Quantification of data from westerns as in (C). Data are represented as mean ± SD (n = 3). Statistical comparisons were referenced to the wild-type #1 value for each treatment.
(E) Northern blot of four clones under the indicated treatments. Data are from the same blot, but displayed vertically for presentation (dashed lines).
(F) FISH analysis (as in Figure 2C) of HCT116 and ISS-reversed clone #14 ± TG. Scale bar, 5 μm.
