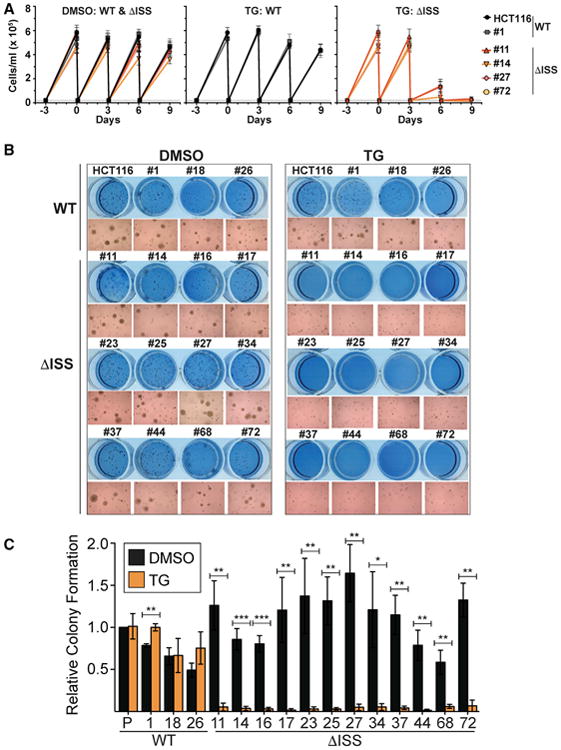
Figure 5. The ISS Is Essential for O-GlcNAc Homeostasis in Cultured Colorectal Cancer Cells.

(A) Growth curves of the indicated lines after DMSO (left) or TG treatment (middle, right). Treatment was initiated at day 0. Cells were counted and re-seeded at 0.2 × 10⁵ cells/ml (dashed line) every 3 days.
(B) Representative soft agar assay using wild-type and ISS-deletion clones shown as crystal violet staining or 10× magnified image.
(C) Quantification of soft agar assays. Values are relative to the HCT116 (P) DMSO-treated cells. Data are represented as mean ± SD (n = 3). Statistics compared DMSO to TG treatment.
