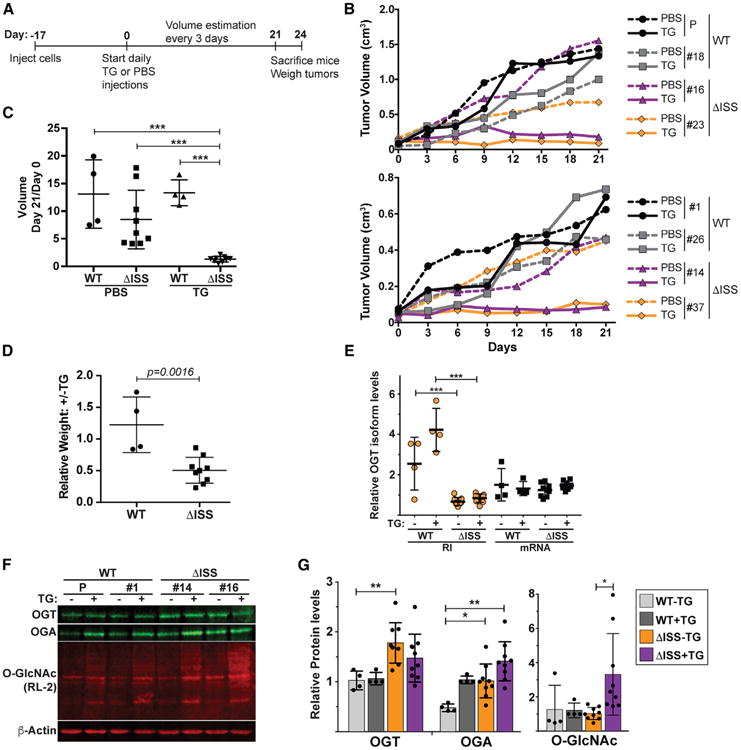
Figure 6. The ISS Is Important for O-GlcNAc Homeostasis in Colorectal Cancer Cell Tumors Grown In Vivo.

(A) Time line of xenograft experiments.
(B) Representative growth curves of wild-type and ΔISS tumor volumes in vivo. Wild-type clones are in black and gray and mutants in purple and orange. Growth of control (PBS) and TG-treated mice are in dashed and solid lines, respectively.
(C) Plot comparing the estimated tumor volumes at day 21 relative to day 0 post-treatment. The vertical line is the mean and the error bars are SD.
(D) Ratio of the ± TG tumor weights derived from each individual clone.
(E) qRT-PCR results of OGT isoforms in tumor samples. Primers amplify a sequence within the OGT-RI or across the exon 4–5 junction (mRNA). The OGT data were normalized to GAPDH and are presented relative to the mRNA signal for the parental clone. See Figure S4E for data on each individual tumor.
(F) Representative western blots using protein extracted form tumor samples.
(G) Quantification of protein from western blots as in (F). Bars represent the mean, error bars are SD, and each data point is shown (n = 3). If no asterisks are shown, the comparisons were not statistically significant. WT+TG samples were excluded from statistical tests as one of these values was set to 1 for normalization in each western blot. See also Figure S4.
