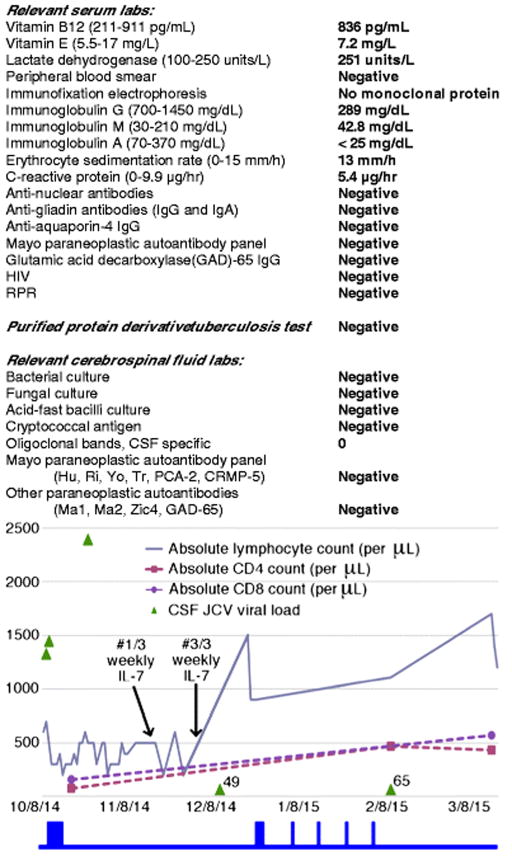
Fig 2.
Laboratory work-up and trends of absolute, CD4, and CD8 lymphocyte counts in serum alongside the trend of JC virus (JCV) viral load in cerebrospinal fluid (CSF). The start of the three-week course of weekly IL-7 therapy (#1/3) and the end of therapy (#3/3) are indicated by arrows. The blue boxes below the graph correspond with periods of time when IV methylprednisolone was administered (October 2014, 1g/day x 5 days; December 2014, 1g/day x 3 days; January – February 2015, 1g/week x 4 weeks). The JCV viral load in copies/mL is noted for the last two measurements

