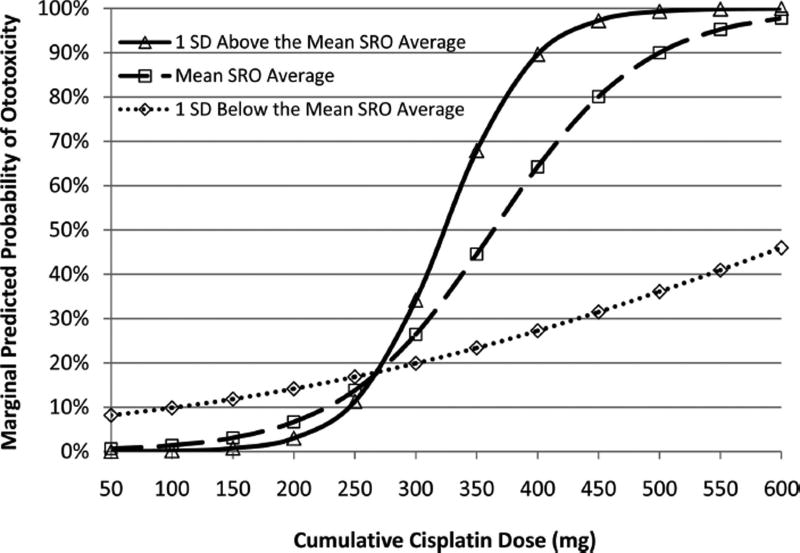
Fig. 4.
Marginal predicted probability of ototoxicity by cumulative drug dose and pre-exposure hearing. Plot of predicted probability of ototoxicity (y axis) by cumulative drug dose (x axis), ranging from 100 to 600 mg, which is stratified by pre-exposure hearing for the mean (dashed line with open squares), 1SD below the mean (poorer hearing indicated by the dotted line with open diamonds), and 1SD above the mean (better hearing indicated by solid line with open triangles).

