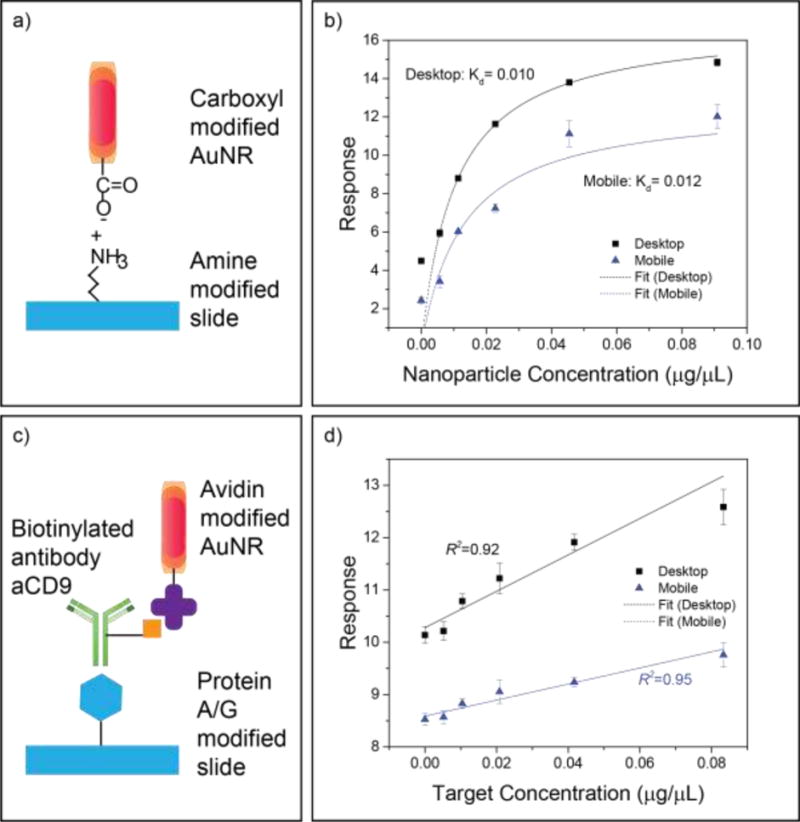
Figure 4.

Comparison of MDFM and DDFM for binding affinity and protein quantification assays. (a and b) Assay scheme and binding affinity result. (c and d) Assay scheme and target (anti-CD9) quantification result. Data points represent the mean ± SEM of 5 sample replicates.
