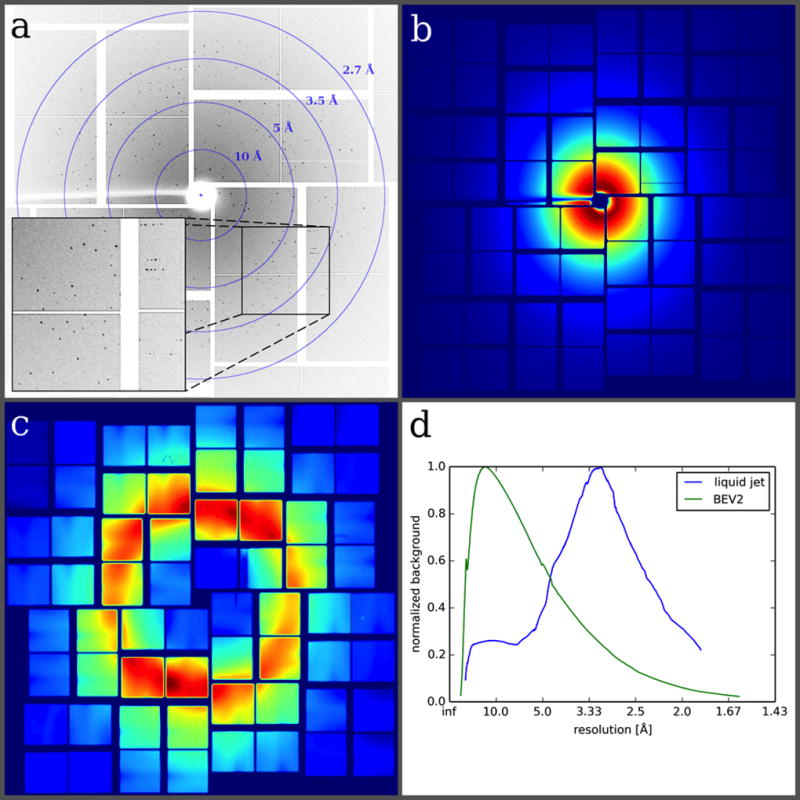
Figure 3. Exemplary BEV2 diffraction pattern and comparison of background scattering levels achievable with different sample delivery methods.

(a) Diffraction image of BEV2 microcrystals obtained at the XPP instrument at LCLS using the micro-patterned silicon chip as a sample holder. (b) Due to the efficient removal of successive mother liquor during sample loading, no water ring is observed in the averaged background image of the chip. (c) For comparison, an averaged background image from a typical SFX liquid jet experiment with CPV 17 crystals47 is shown. (d) The azimuthally averaged radial distribution of both images is plotted as a function of resolution. Both curves are normalized since measurements were performed under different experimental conditions and therefore a direct comparison was not possible.
