
Fig. 3. Experimental characterization of designed proteins for each fold.
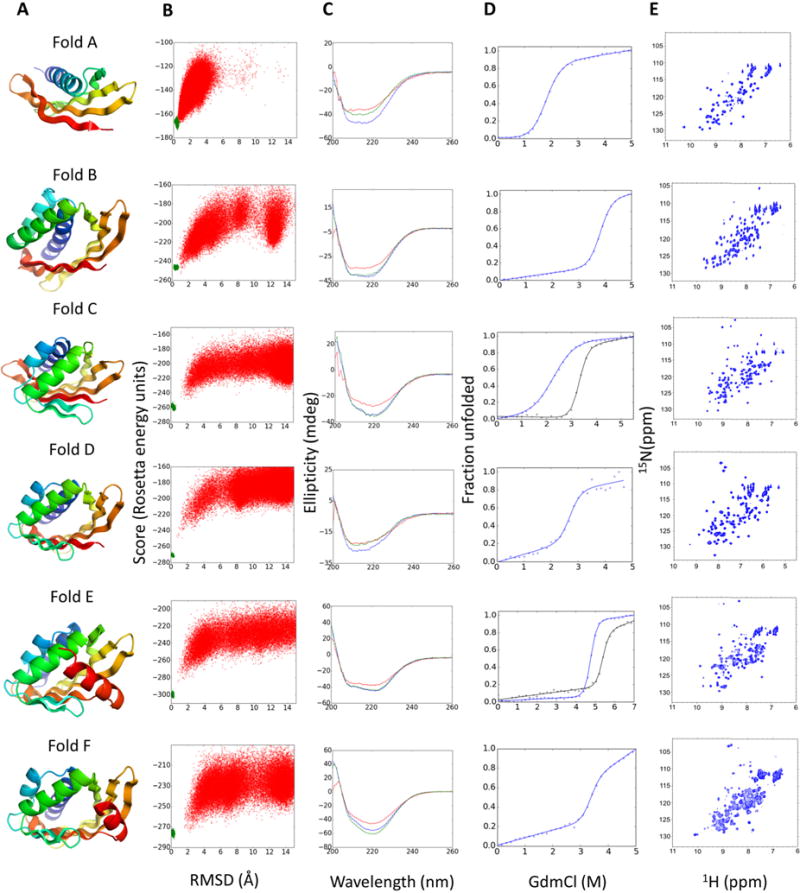
(A) Examples of design models for each fold. (B) Folding energy landscapes generated by ab initio structure prediction calculations. Each dot represents the lowest energy structure identified in an independent trajectory starting from an extended chain (red dots) or from the design model (green dots); x-axis shows the Cα-root mean squared deviation (RMSD) from the designed model; the y-axis shows the Rosetta all-atom energy. (C) Far-ultraviolet circular dichroism spectra (blue: 25 °C, red: 95 °C, green: 25 °C after cooling). (D) Chemical denaturation with GdmCl monitored with circular dichroism at 220 nm and 25 °C. For folds C and D the denaturation curves for designs stabilized by a disulfide bond or a dimer interface are shown in black lines. (E) 1H–15N HSQC spectra obtained at 25 °C.