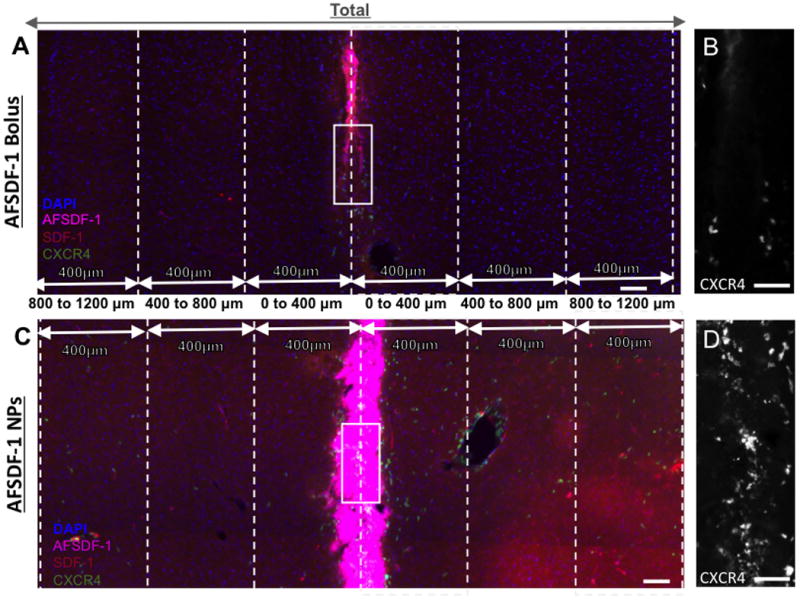
Figure 1.

Representative fluorescent images of cortical tissue sections and the regions of interest (ROIs) used to quantify fluorescent signals. (A) Cortical reconstruction centered at the injection tract after a bolus injection of AFSDF-1 and (B) AFSDF-1 loaded PLGA NPs. All tissue sections were immunostained for SDF-1 (red) and cell nuclei (DAPI; blue) with exogenous AFSDF-1 magenta) and EGFP-CXCR4 (green). All cortical reconstructions (2.8mm×1mm) were divided into a 400 μm bins stemming from the center of the needle tract. The figure depicts truncated regions of the distal ROI for illustration purposes and extends further medially and laterally. (B) & (D) are magnified representations of the needle tract outlined in white for bolus and NP implant groups, respectively. Scale bars = 100 μm for A & C; scale bar = 30 μm for B & D.
