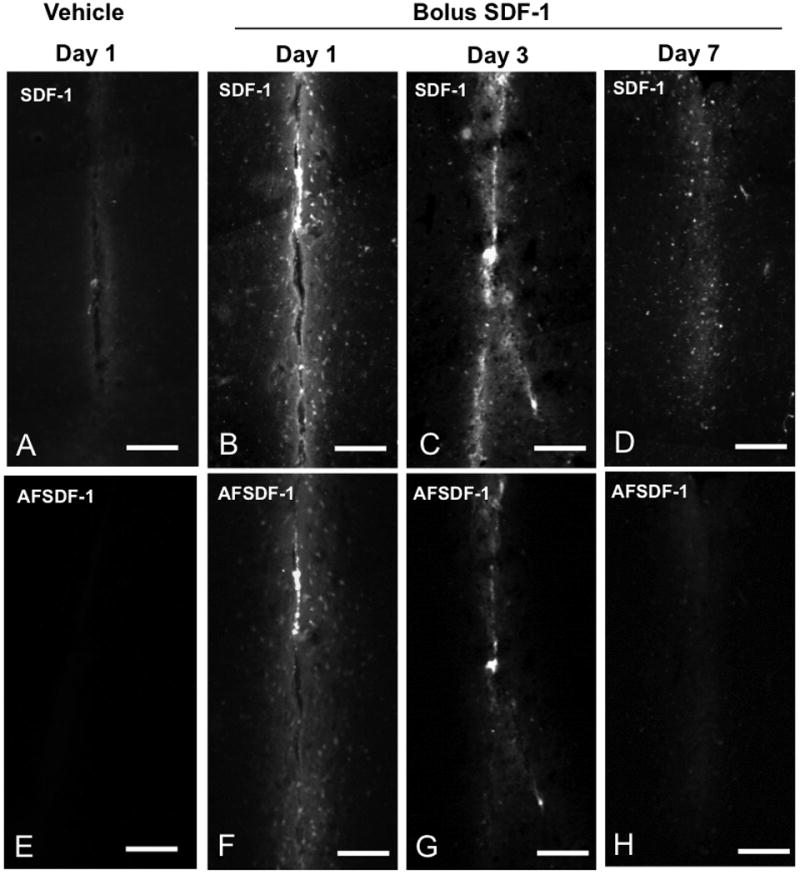
Figure 2.

Representative AFSDF-1 and SDF-1 Immunostained images for vehicle (day 1, A, E) and SDF-1 bolus at day 1, 3, and 7; B-D and F-H). The top row consists of representative SDF-1 immunostained images, whereas the bottom row depicts corresponding AFSDF-1 images. Scale bar = 100 μm. It is important to note that these representative images in the comprise only ∼400 μm × 800 μm centred around the injection tract and constitute only a small fraction of the larger 3.2mm × 1.0 mm ROI used for the entire analysis.
