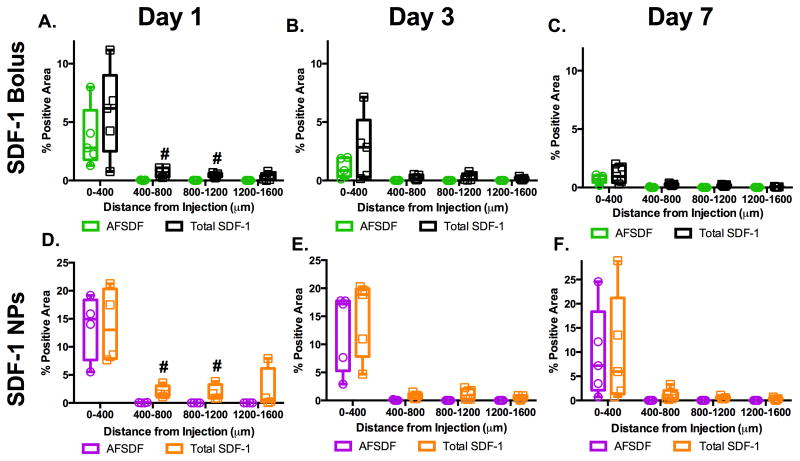
Figure 6.
Comparison of AFSDF-1 to total SDF-1 positive area. Overlay of AFSDF-1 and total SDF-1 immunostain area in response to SDF-1 bolus (A-C) or SDF-1 NPs (D-F) revealed significantly higher levels of total SDF-1 immunostain at 400-800 μm and 800-1200 μm at day 1 (A, D; #p < 0.05). The AFSDF-1 and total SDF-1 staining pattern essentially matched for days 3 and 7 for both groups (B, C and E, F). Box and whisker plots used to demonstrate the span of data points within each group; n = 4-5 animals per group.

