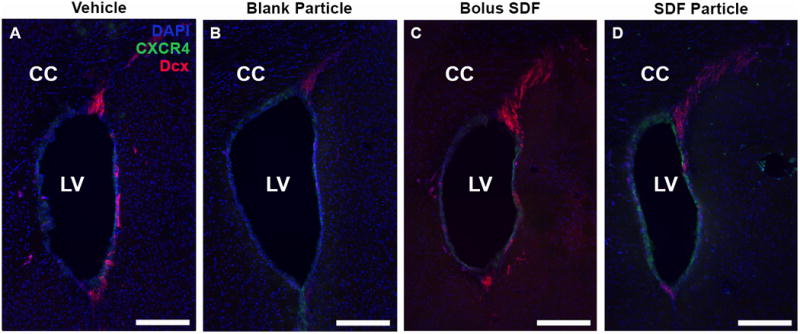
Figure 8.

Neuroblast migration from SVZ. Representative day 1 images revealed prominent neuroblast migration in response to all injection conditions as visualized with Dcx staining (red) stemming from the SVZ. (A) Vehicle, (B) Blank NP, (C) SDF-1 bolus, and (D) SDF-1 NPs. Note the CXCR4+ cells (green) surrounding the lateral ventricles, but the migrating Dcx+ cells are not CXCR4+. LV = Lateral ventricle. Red = Dcx, Green = CXCR4, Blue = DAPI; Scale bar = 200 μm.
