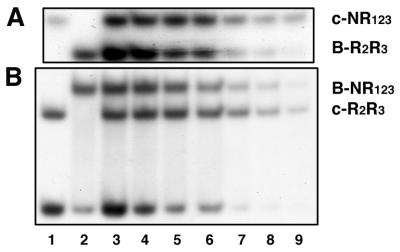
Figure 6.
Competition between c- and B-Myb for the same MRE. Titration of protein–DNA complexes with decreasing amounts of DNA. Proteins of unequal size were used to allow the complex to be resolved. As a reference of migration, lanes 1 and 2 show c-Myb alone (4 fmol NR123 and 5 fmol R2R3) and B-Myb alone (40 fmol R2R3 and 30 fmol NR123), respectively, bound to 35 fmol MRE-mim1A probe. Complexes were allowed to form for 15 min at 25°C. After incubation the samples were analysed by EMSA (as described in Materials and Methods). (A) Lanes 3–9, complex formation in a mixture containing 4 fmol c-Myb NR123, 40 fmol B-Myb R2R3 and decreasing amounts of MRE-mim1A probe (35–2.5 fmol). Complexes were allowed to form for 15 min at 25°C. After incubation the samples were analysed by EMSA (as described in Materials and Methods). (B) A similar analysis was performed with 30 fmol B-Myb NR123, 5 fmol c-Myb R2R3 and decreasing amounts of MRE-mim1A probe (35–2.5 fmol).

