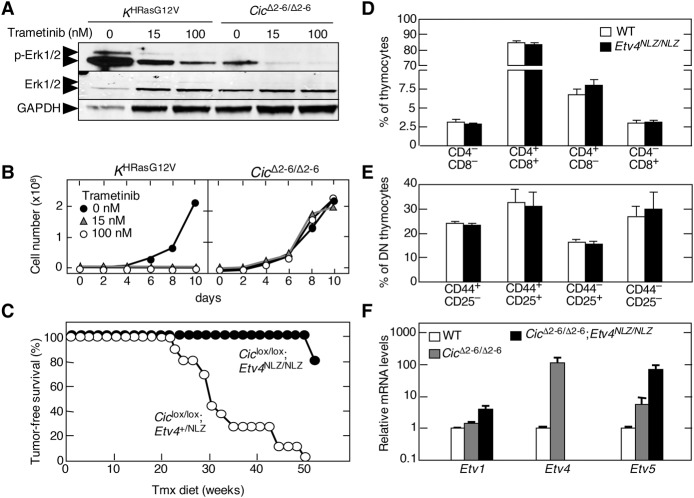
Figure 5.
Murine T-ALL driven by Cic inactivation is resistant to MEK inhibition and requires Etv4. (A) Western blot analysis of p-Erk1/2 and total Erk1/2 in T-ALL cells obtained from tumors developed in Tmx-treated KHRasV12;hUBC-CreERT2+/T (left) or Ciclox/lox;hUBC-CreERT2+/T (right) mice treated with the indicated concentrations of trametinib for 24 h. GAPDH expression served as a loading control. (B) Growth curve of T-ALL cells obtained from tumors developed in Tmx-treated KHRasV12;hUBC-CreERT2+/T (left) or Ciclox/lox;hUBC-CreERT2+/T (right) mice treated with the indicated concentrations of trametinib for the indicated time. (C) Tumor-free survival of Ciclox/lox;Etv4+/NLZ;hUBC-CreERT2+/T (open dots; n = 11) or Ciclox/lox;Etv4NLZ/NLZ;hUBC-CreERT2+/T (closed dots; n = 5) mice subjected to a continuous Tmx diet starting at 4 wk of age. (D) Percentage of thymocyte populations in 1-mo-old wild-type (open bars; n = 3) or Etv4NLZ/NLZ (closed bars; n = 3) mice. CD4/CD8-double-negative, CD4/CD8-double-positive, CD4-single-positive, and CD8-single-positive populations are shown. Data represent mean ± SD. (E) Percentage of CD4/CD8 double-negative (DN) thymocyte subpopulations in 1-mo-old wild-type (open bars; n = 3) or Etv4NLZ/NLZ (closed bars; n = 3) mice. DN1 (CD44+/CD25−), DN2 (CD44+/CD25+), DN3 (CD44−/CD25+), and DN4 (CD44−/CD25−) subpopulations are shown. Data represent mean ± SD. (F) Relative expression levels of Etv1, Etv4, and Etv5 mRNAs in wild-type thymuses (open bars; n = 2); T-ALLs developed in Tmx-treated Ciclox/lox;hUBC-CreERT2+/T mice (CicΔ2–6/Δ2–6; red bars; n = 2); or the only tumor that developed in Tmx-treated Ciclox/lox;Etv4NLZ/NLZ;hUBC-CreERT2+/T mice (CicΔ2–6/Δ2–6;Etv4NLZ/NLZ; closed bars). β-Actin expression levels were used for normalization. Data represent mean ± SD.

