Figure 6.
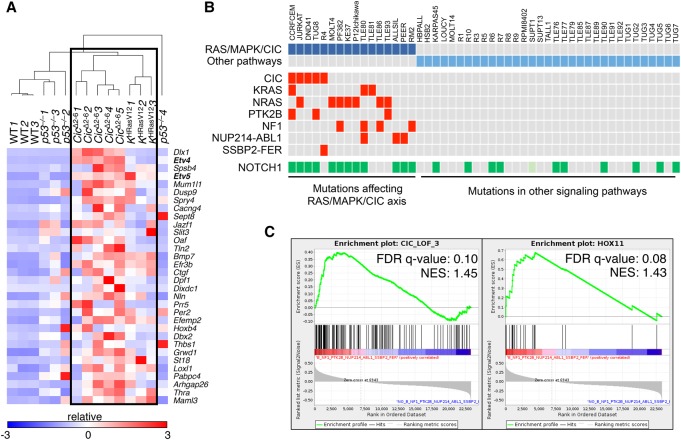
A gene signature indicative of Cic LOF is enriched in mouse and human T-ALL driven by inactivation of Cic or activation of the Ras/MAPK pathway. (A) Heat map generated by unsupervised clustering of differentially expressed genes present in a 32-gene Cic LOF signature (CIC_LOF_4), as estimated by RNA-seq from wild-type thymuses and T-ALLs developed in Tmx-treated Ciclox/lox;hUBC-CreERT2+/T as well as KHRasV12;hUBC-CreERT2+/T mice or p53−/− animals at a humane end point. Gene symbols are indicated, and relative expression (log2 fold change) is scaled in color (as indicated) from dark blue (−3) to dark red (+3). (B) Indication of point mutations and gene fusions present in a published data set of human T-ALL samples (from Atak et al. 2013). Samples carrying protein-altering mutations and fusions that are predicted to activate the RAS/MAPK/CIC axis are indicated in dark blue, and those harboring mutations affecting other pathways are indicated in light blue. The mutations affecting specific genes in each sample are indicated in red (only for the RAS/MAPK/CIC group). NUP214-ABL1 and SSBP2-FER represent gene fusions identified in selected samples. Mutations in NOTCH1 are indicated in green. The SUPT1 cell line harbors a gene fusion that causes overexpression of NOTCH1 (light green). (C) Enrichment plot showing significant enrichment (FDR < 25%) of a 143-gene signature indicative of CIC LOF (CIC_LOF_3; left) or a TLX1+ (HOX11+; right) gene signature in human T-ALL samples predicted to have an active RAS/MAPK/CIC axis (from B). (NES) Normalized enrichment score.

