Figure 4.
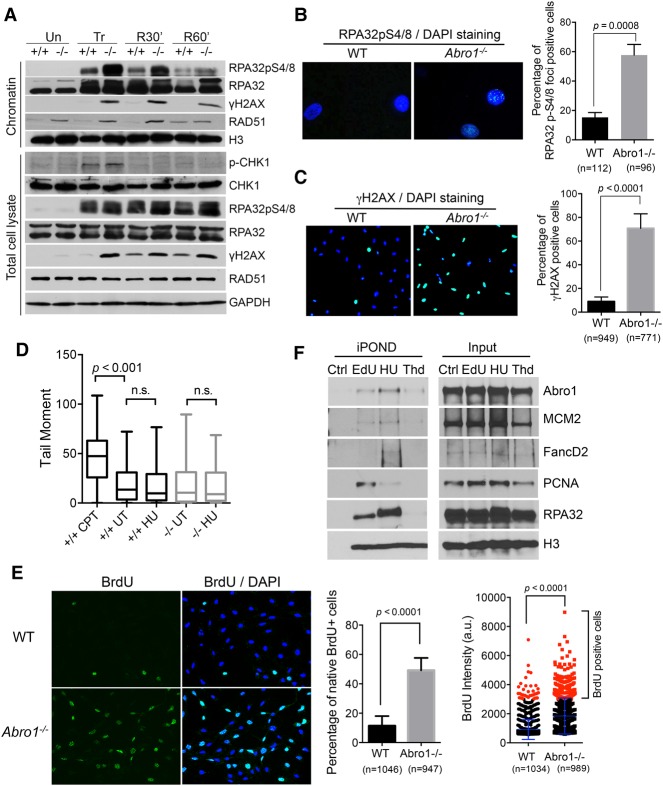
Abro1 suppresses uncontrolled resection. (A) Wild-type or Abro1−/− MEFs were either untreated (Un) or treated with 4 mM HU for 4 h (Tr) followed by release into fresh medium for 30 min (R30′) or 60 min (R60′). Western blot was carried out with the indicated antibodies on chromatin fraction or total lysate samples. (B) Increased RPA32pS4/8 in Abro1−/− cells. Overlaid images of immunofluorescence with RPA32pS4/8 antibody and DAPI staining are shown. (C) Increased γH2AX in Abro1−/− cells. Overlaid images of immunofluorescence with γH2AX antibody and DAPI staining are shown. (D) Neutral comet assay for cells untreated or treated with 4 mM HU for 4 h. Wild-type cells treated with 1 µM camptothecin (CPT) for 1 h were used as a control. Tail moment was measured, and P-value was determined by Student's t-test. (E) Increased ssDNA in Abro1−/− cells. Wild-type or Abro1−/− cells were labeled with BrdU overnight before treatment with 4 mM HU for 4 h. Immunofluorescence using BrdU antibody was carried out under native conditions. Relative BrdU labeling intensity (a.u.) was analyzed, and a cutoff value was used for scoring BrdU-positive cells. The percentage of cells with BrdU-positive (BrdU+) staining was determined. P-value was determined by Student's t-test. (F) Abro1 is present at unperturbed and stalled replication forks using isolation of proteins on nascent DNA (iPOND) analysis. Cells were pulse-labeled with EdU for 10 min (EdU), labeled with EdU followed by treatment with 2 mM HU for 2 h (HU), or labeled with EdU followed by thymidine chase for 2 h (Thd). Control (Ctrl) is the “no Click” sample. EdU-labeled newly synthesized DNA was captured, and bound proteins were analyzed by Western blot.

