Figure 5.
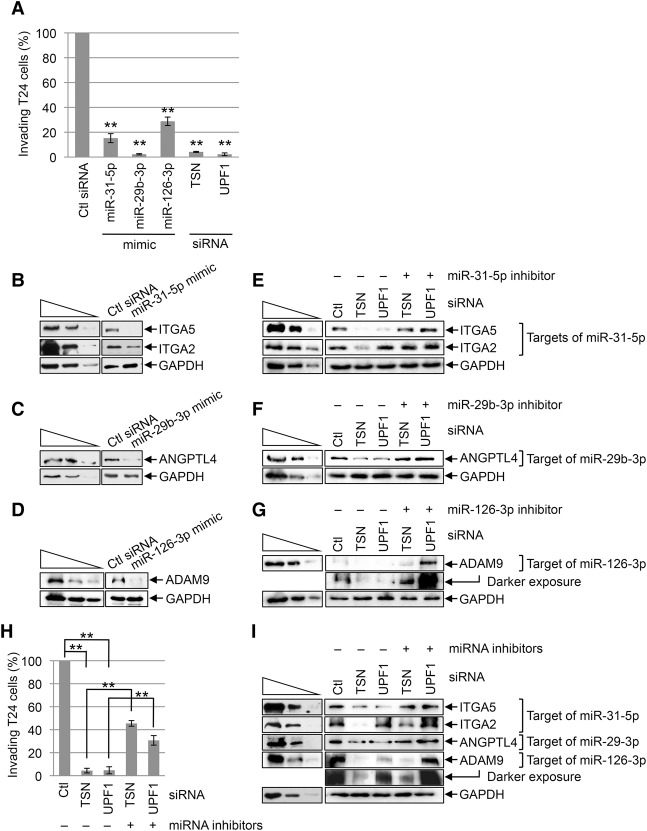
TumiD promotes bladder cancer cell invasion. (A) Histogram representing quantitation of T24 cell invasion (Supplemental Fig. S4A). Cells were transfected with the designated siRNA or miRNA mimic, and the number of invading control (Ctl) siRNA transfected cells is defined as 100. (B) Western blotting of lysates of T24 cells transfected with control siRNA or a miR-31-5p mimic. (C) As in B except cells were transfected with control siRNA or a miR-29b-3p mimic. (D) As in B except cells were transfected with control siRNA or a miR-126-3p mimic. (E) Western blotting of T24 cells transfected with the designated siRNA along with a control inhibitor (−) or miR-31-5p inhibitor. (F) As in E except cells were transfected with a control or miR-29b-3p inhibitor. (G) As in E except cells were transfected with a control or miR-126-3p inhibitor. (H) As in A except cells were transfected with the designated siRNA along with either a control inhibitor (designated “−” miRNA inhibitors) or a cocktail of miR-31-5p, miR-29b-3p, and miR-126-3p inhibitors (designated “+” miRNA inhibitors) (see also Supplemental Fig. S4C). (I) As in E except cells were transfected with a control inhibitor (−) or a cocktail of miR-31-5p, miR-29b-3p, and miR-126-3p inhibitors (+ miRNA inhibitors). All results are representative of three or more independently performed experiments. (**) P < 0.01. n ≥ 3. Error bars represent ±S.D.

