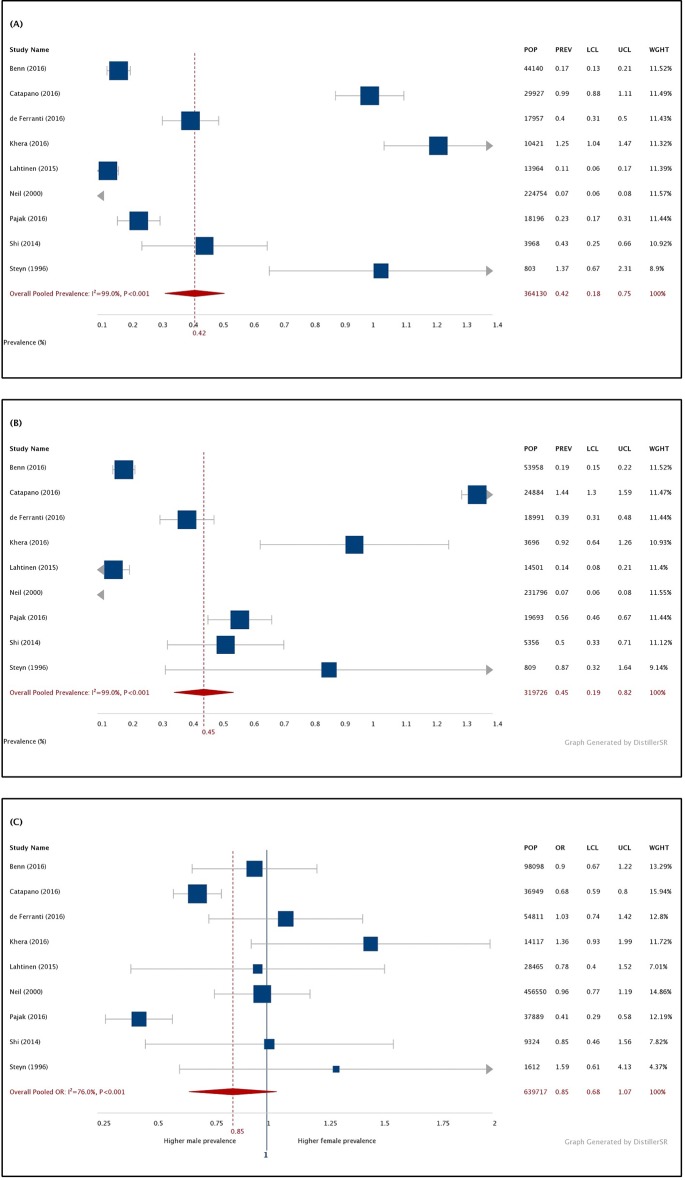
Figure 4.
(A) Forest plot of pooled prevalence (%) of heterozygous FH in the male population. (B) Forest plot of pooled prevalence (%) of FH in the female adult population. (C) Forest plot of pooled OR of male:female FH prevalence. FH, familial hypercholesterolaemia; I2, between-study heterogeneity; LCL, lower confidence limit; POP, population; PREV, prevalence; UCL, upper confidence limit; WGHT, weight under the random-effects model. Note: prevalence estimates were derived using the double-arcsine method, back-transformed and expressed as percentages for ease of interpretation.

