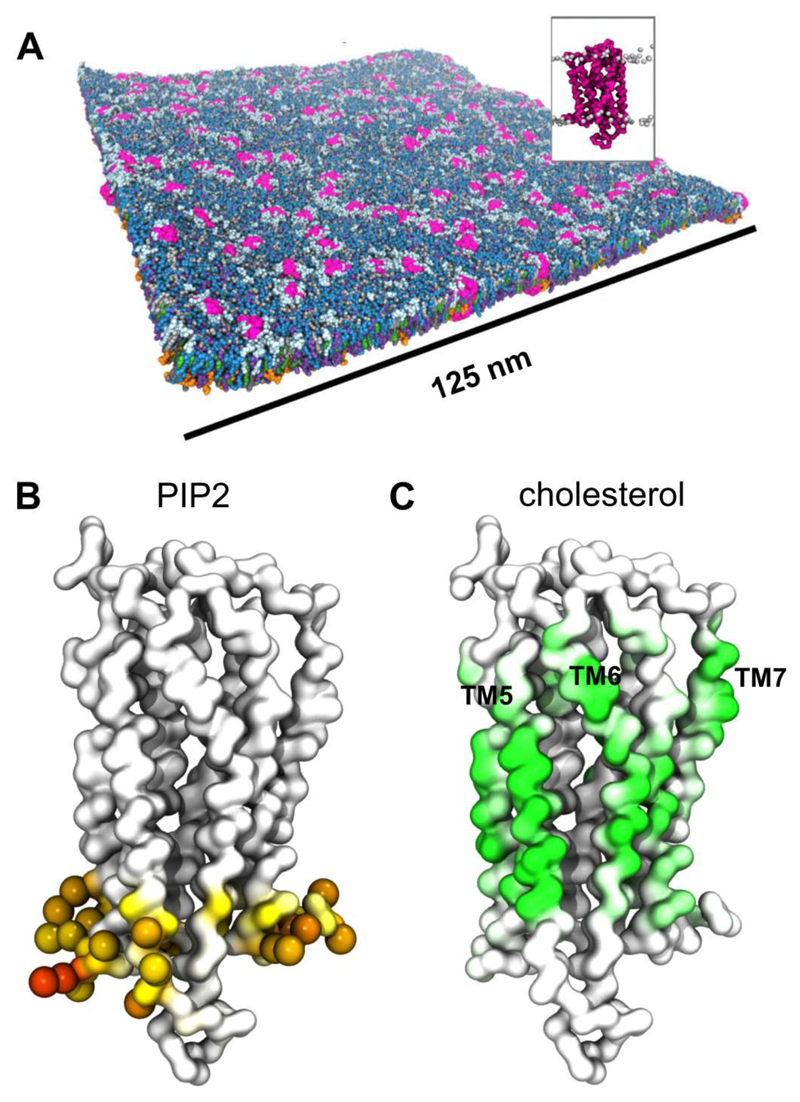
Figure 6.
Lipid interactions of the S1P1 receptor. (A) 144 S1P1 GPCR molecule (pink; see inset figure) embedded in a bilayer the lipid composition of which corresponds to that of a mammalian cell membrane. The image shown is from the end of a 10 µs CG-MD simulation [47]. (B) Model of the S1P1 receptor coloured according to the level of PIP2 phosphoryl head group interaction, from white (no interaction) to orange (high interaction). Residues with high levels of PIP2 interaction (>75% of simulation time) are shown as spheres. (C) The S1P1 receptor coloured according to the degree of cholesterol interaction from white (no interaction) to green (high interaction). We thank Dr. Heidi Koldsø for the figure. Figure (adapted) reprinted with permission from [47]. Copyright (2015) American Chemical Society.

