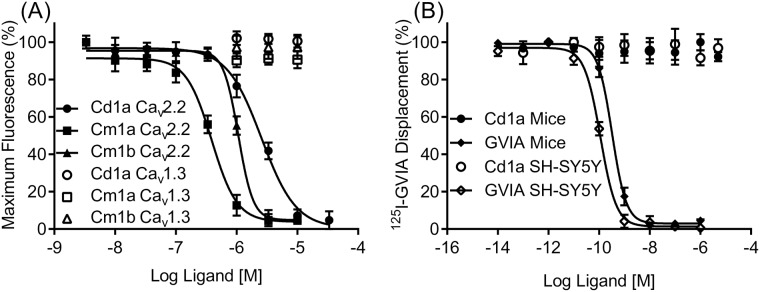
Fig 2. Activity of Cd1a, Cm1a and Cm1b on human CaV channels.
Representative concentration-response curves for Cd1a and Cm1a—b obtained using fluorescence-based Ca2+ imaging assays. (A) Cd1a and Cm1a—b fully inhibited KCl/CaCl2-activated hCav2.2 responses in SH-SY5Y cells (IC50 values (μM): Cd1a 2.6 ± 0.93, Cm1a 0.4 ± 0.2 and Cm1b 0.08 ± 0.02) but not Cav1.3 or Cav3.1 (IC50 > 10 μM). (B) Sigmoidal concentration response curves representing one single 125I-GVIA binding assay experiment. Unlabeled GVIA fully displaced 125I-GVIA from SH-SY5Y cell membranes (IC50 = 0.18 ± 0.01 μM) and mouse brain membranes (IC50 = 0.27 ± 0.01 μM), whereas Cd1a was unable to displace 125I-GVIA at concentrations up to 10 μM. Data points are mean ± S.E.M (n = 3–6 replicates).

