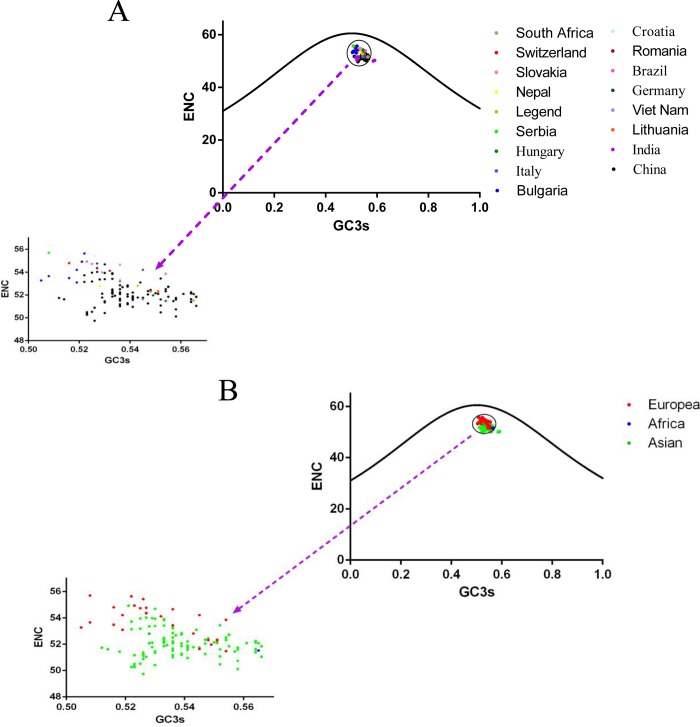
Fig 1. ENC plots displaying the relationships between ENC and the GC content at the third codon position (GC3s) in relation to geographical distribution.
(A) isolated countries, (B) isolated continents, depicted in different colors. It's essential to note that the curve represent the expected relationship between ENC and GC3s, thus, justly GC3s contributes to the codon usage bias.

