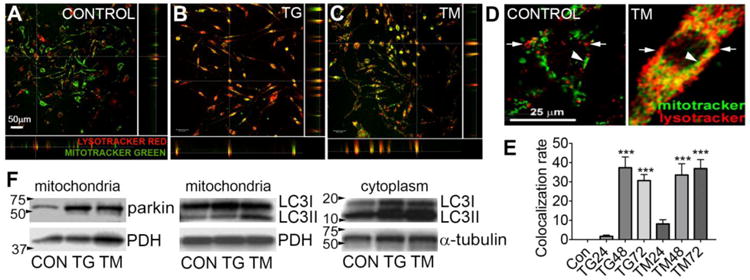
Figure 2. ER stress induces mitophagy in bEnd5 cells.

Confocal images show that compared to controls (A), TG (B) and TM (C) increase lysosomes (identified by lysotracker green) and increase their association with mitochondria (identified by mitotracker red), at 48 h of ER stress. D) Higher magnification images showing individual lysosomes (arrowheads) and mitochondria (arrows) in controls with essentially no co-localization, but a high degree of overlap (yellow) after ER stress, shown here with TM. E) Analyses of co-localization in 3-D Z-stacks showed significantly greater co-localization of green and red pixels with TG and TM at 48 and 72 h compared to controls (CON). N = 3 independent experiments. ***p<0.001 compared to control. F) TG and TM induced mitophagy also shown by Western blots of mitochondrial cell fractions probed for parkin, which translocates to the mitochondria as part of the mitophagy process. PDH = mitochondrial loading control. The autophagy and mitophagy marker, LC3II was increased in both mitochondrial and cytoplasmic fractions. Blots are representative of n=2.
