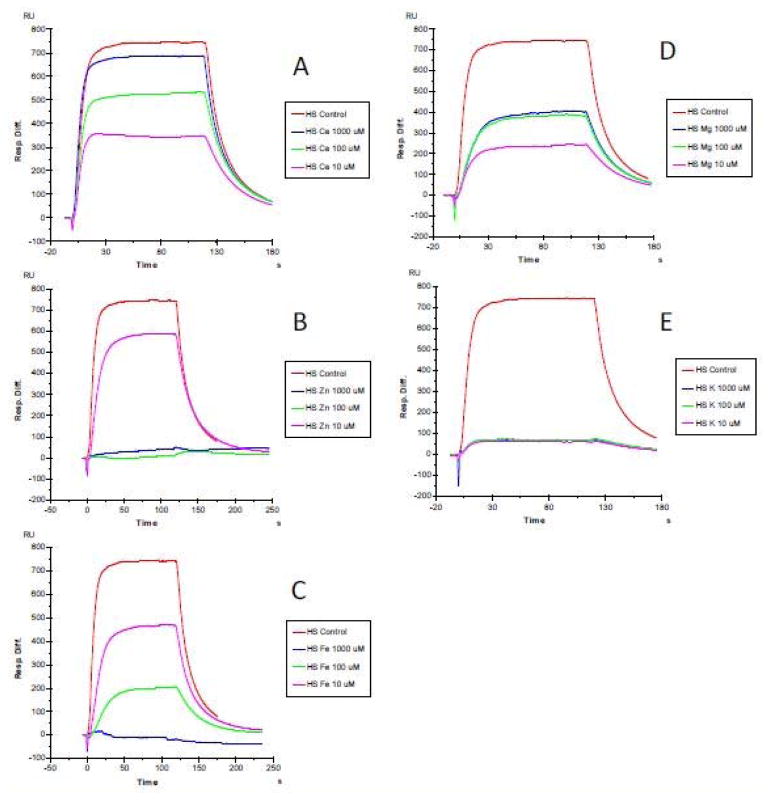
Figure 2.
SPR sensorgrams of HS-FGF1 interaction with the addition of metals ions. FGF1 concentration was 500 nM. A: HS-FGF1 interaction with the addition of CaCl2 (0, 10, 100 and 1000 μM); B: HS-FGF1 interaction with the addition of ZnCl2 (0, 10, 100 and 1000 μM); C: HS-FGF1 interaction with the addition of FeCl3 (0, 10, 100 and 1000 μM); D: HS-FGF1 interaction with the addition of MgCl2, (0, 10, 100 and 1000 μM); E: HS-FGF1 interaction with the addition of KCl (0, 10, 100 and 1000 μM).

