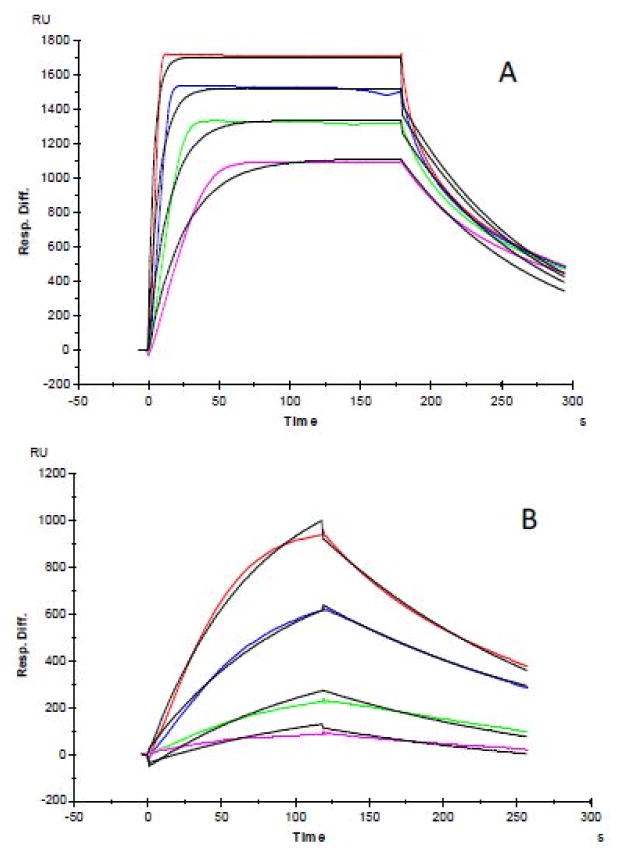
Figure 6.
SPR sensorgrams of heparin-FGF1 interaction with the addition of mixed metals ions in physiological concentrations. A: SPR sensorgrams of heparin-FGF1 interaction without addition of mixed metals ions; Concentrations of FGF1 (from top to bottom): 500, 250, 125 and 63 nM, respectively. The black curves are the fitting curves using models from BIAevaluate 4.0.1.

