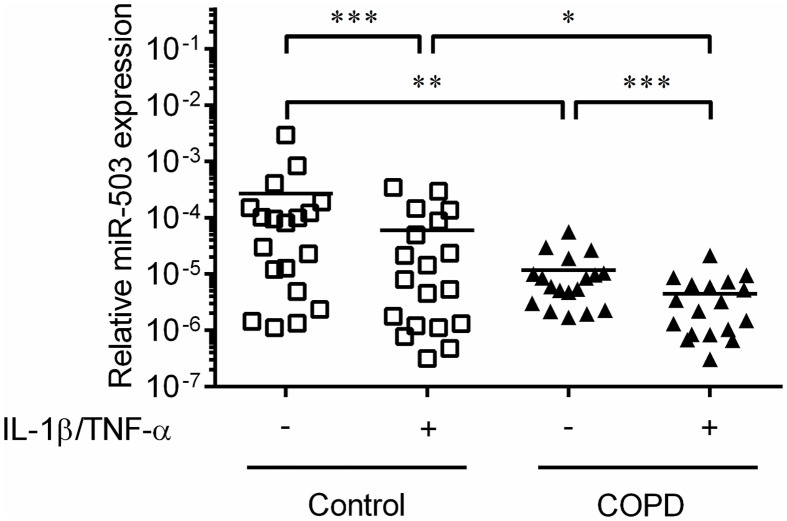
Fig 2. MiR-503 expression in COPD and control lung fibroblasts in the absence or presence of IL-1ß and TNF-α.
Control (White square, n = 19) and COPD (Black triangle, n = 18) lung fibroblasts were cultured with 10% FCS containing DMEM for 2 days, after which the medium was changed to DMEM in the absence and presence of IL-1ß and TNF-α (1 ng/ml). After 1 day, total RNA was extracted from the cultured cells. MiR-503 expression was examined by real time qPCR. Vertical axis: level of miR-503 expression, expressed as fold of 18s-rRNA values in the same sample. Horizontal axis: culture condition. *p < 0.05, **p < 0.01, ***p < 0.001.

