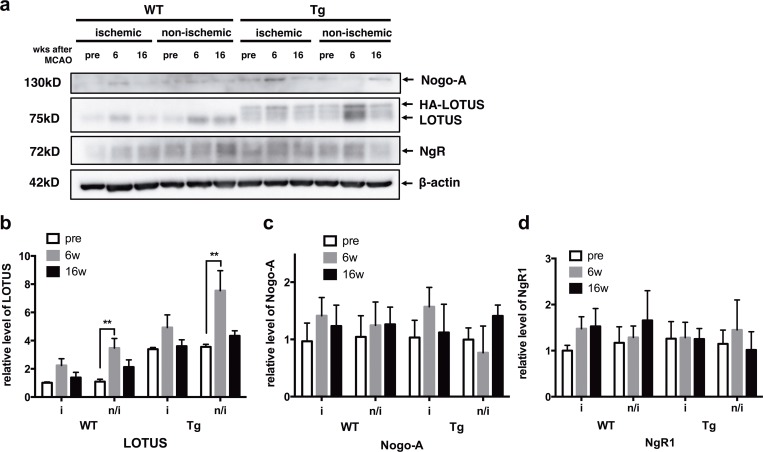
Fig 2. LOTUS, Nogo-A and NgR1 expression in WT and LOTUS-Tg mice.
(a) Protein (20 μg) from lysates of each animal in pre-stroke, 6, and 16 weeks after MCAO was analyzed. (b-d) Quantitative analysis of expression level in LOTUS, Nogo-A, and NgR1. Immunoblots were normalized with β-actin. (b) Increases in LOTUS expression in the non-ischemic side of both WT and LOTUS-Tg mice 6 weeks after MCAO were found. (c, d) No significant difference was seen in Nogo-A and NgR1 expression. (2-way ANOVA with Tukey post hoc analysis; **p < 0.01. Data are mean ± S.E.M. n = 3).

