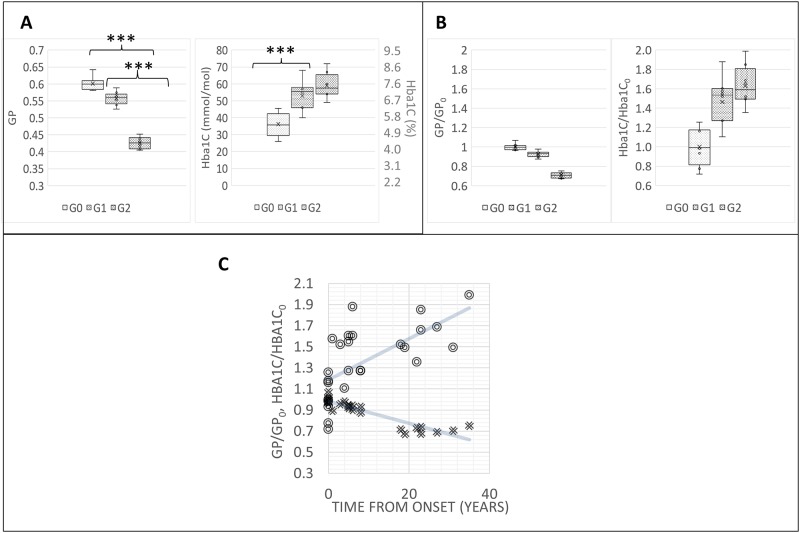
Fig 2. RBC fluidity allows to classify patients with and without complications, and increases with time after the first diagnosis.
(A) Mean GP values and HbA1c values of different groups G0: control; G1: T1DM, no complications; G2: T1DM with complications. *** stays for p<0.001. (B) Mean GP values and HbA1c values normalized to GP0 and HbA1c0 values (average over the G0) of different subgroups. (C) Mean GP values and HbA1c normalized values of RBC fluidity variations with time after the first diagnosis. Solid lines represent linear regression curves. The slopes of the Hba1C/Hba1C0 curve is 0.0195 y-1, while the slope of the GP/GP0 is -0.0104 y-1. R2 values are respectively 0.4213 and 0.8365 for the Hba1C/Hba1C0 and GP/GP0.

