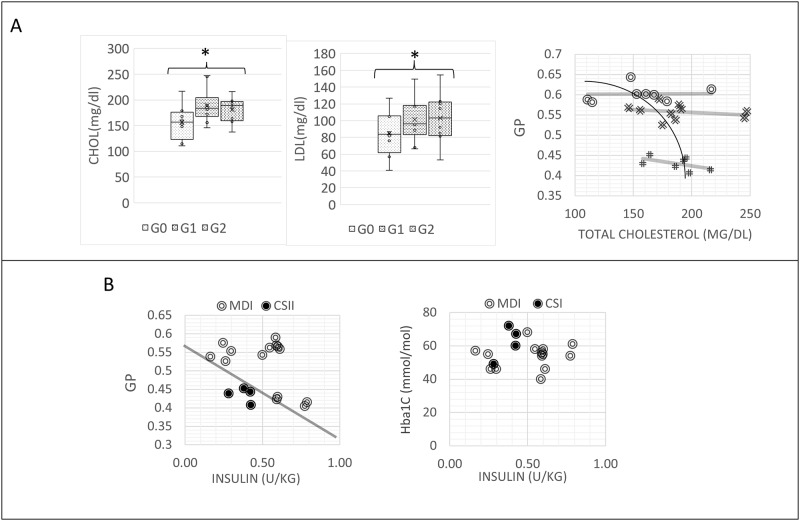
Fig 3. Blood cells cholesterol and LDL increases with RBC fluidity and RBC fluidity increases with administered insulin.
(A) Plasma cholesterol content and LDL content in the different groups. G0: control; G1: T1DM, no complications; G2: T1DM with complications, and relationship between plasma cholesterol content and RBC membrane fluidity in the different groups. * stays for p<0.05. The variation inside group G1 and G2 correspond to an increase of fluidity with cholesterol and LDL content, as evident from the negative slopes of the linear regressions to the data, which are for G0, G1 and G2 respectively 0.0002, -0.0001, -0.0004. the low R2 values (respectively 0.0829, 0.0587 and 0.2788 for G0, G1 and G2) indicate that, apart cholesterol, the linear model has to account for other factors. (B) RBC fluidity is correlated with the units of insulin administered pro Kg. Relationships are different for patients undergoing different intensive insulin therapies: multiple daily injections(MDI) or insulin pump (CSI). The solid line is traced to show the possibility to separate the two groups of data in the plane.

