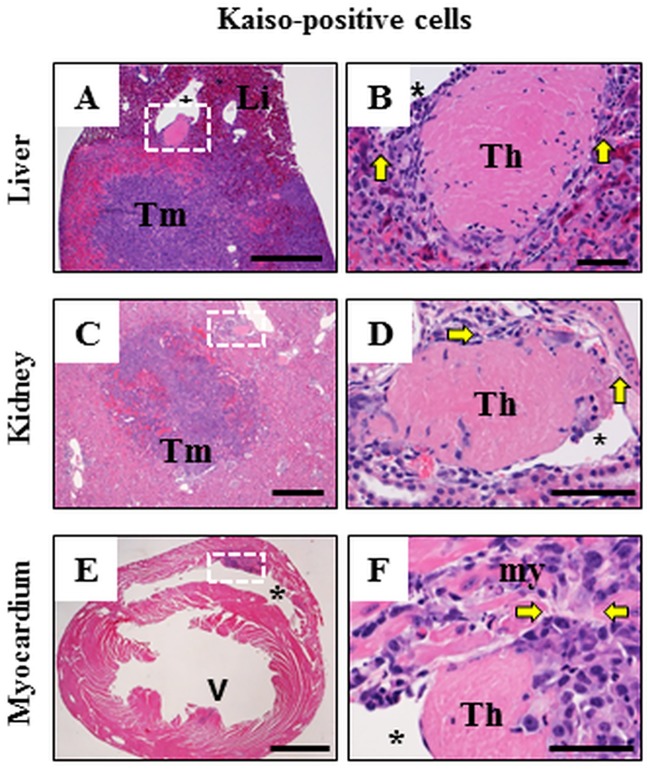
Fig 4. Intravascular invasion of secondary metastatic Kaisopositive tumors.
Low magnification images (A, C, E) and high magnification images (B, D, F) of tissue regions outlined by white dotted lines in A, C and E. Kaisopositive cells metastatic to the liver (A, B) and kidney (C, D) formed large tumors and invaded adjacent blood vessels with formation of thrombi (Th in B, D) delineated from the surrounding tissue by yellow arrows. Tumor masses in the myocardium (white box and arrowhead in E) often resulted in invasion of the ventricle (asterix) with formation of a mass (white box in E) and thrombus (Th in F). Thrombus is delineated from myocardium (my) by yellow arrows in F. There is continuity between the masses of tumor cells in the myocardium and in the intraventricular thrombus (F). H&E. Size bars; A, C, E– 1,000 microns, B, D, F– 50 microns.

