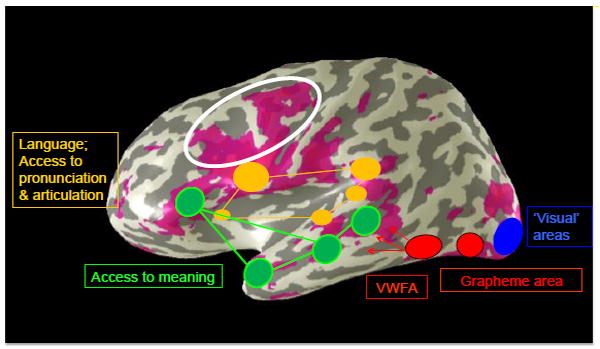
Figure 6. Comparison of Braille and sighted reading networks.

Average lateral activation in the left hemisphere during Braille reading overlaid with the typical network of reading activations in the sighted from Figure 2, with functional attributions of each network keyed by color.
