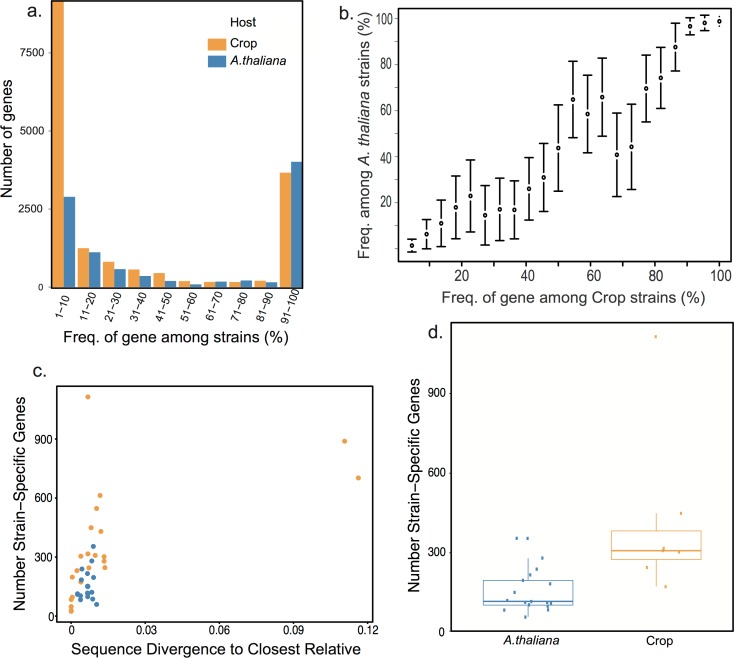
Fig 3. Extensive gene content variation in A. thaliana strains mirrors variation between strains from different hosts.
(a) The frequency of genes among the 18 A. thaliana strains was compared to the frequency of genes across 22 strains collected from different host species, in different locations. Values were binned at 0.1 frequency increments with the number on the x-axis denoting the frequency of a gene across strains. A. thaliana and crop strains have a similar number of fixed and high frequency genes, suggesting that both groups have similar numbers of genes important for survival. However, crop strains have significantly more singleton genes (Welch’s t-test, P = 0.003). (b) Correlation between the frequency of a gene among crop strains and the frequency of the gene among A. thaliana strains. Results are shown as the mean +/ the standard error. (c) Correlation between sequence divergence between a strain and its closest relative with the number of strain-specific genes in that strain (d) The effect observed in (c) is significant also when comparing only those crops strains with divergences similar to those of A. thaliana strains (P = 0.003, Wilcoxon-rank-sum test). Results are presented as a box plot, with the mean, 5,25,75 and 95th percentiles illustrated.

