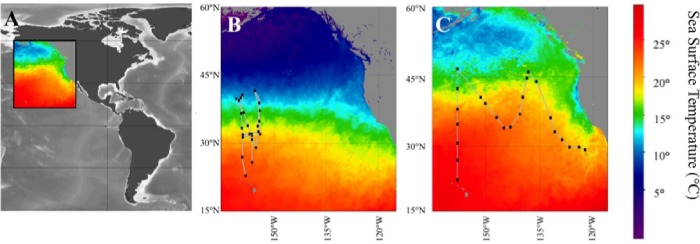
Fig 1. Cruise transects and sampling sites for this study.
(A) Color inset indicates location of panels B and C, (B) POWOW 2 (KM1301) cruise transect, (C) POWOW 3 (KM1312) cruise transect. Represented sea surface temperatures based on average values for duration of the cruises as determined by SEA-WIFS (see Materials and Methods for more details).

