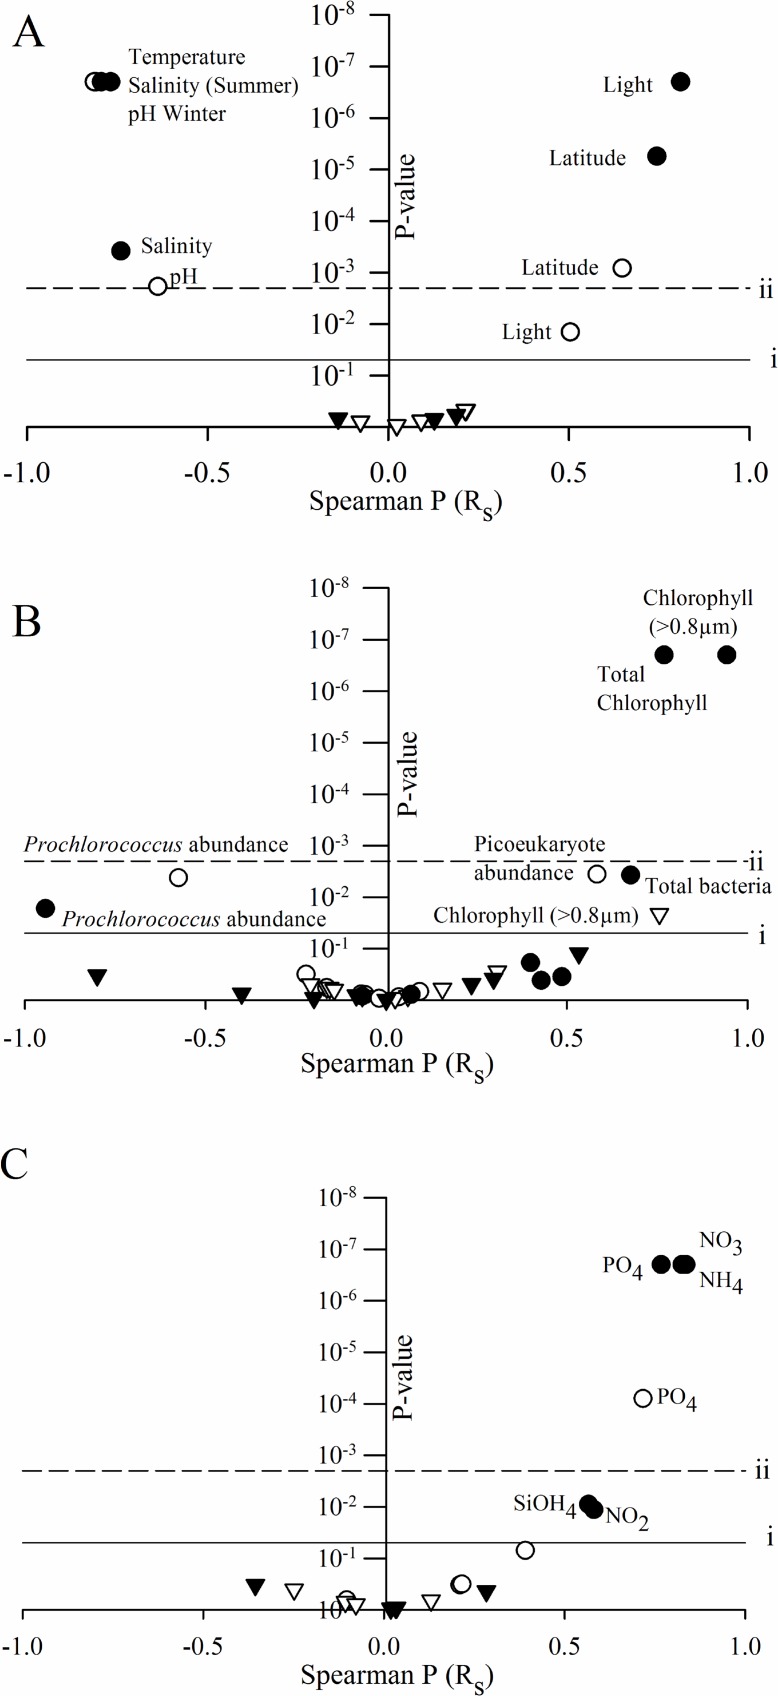
Fig 4. Correlations between virus abundance and productions and environmental parameters.
Spearman correlation coefficient shown on the x-axis and p-values indicated on the y-axis. Parameters were separated according to classifications including: physical (A), biological (B) and nutrient(c) data. Circles indicate spearman correlations of virus abundances while virus production correlations are indicated by triangles. Closed symbols = summer samples and open symbols = winter samples. Horizontal dash line (i) shows a p-value of 0.05; solid line (ii) shows a Bonferonni adjusted p-value of 0.002.

