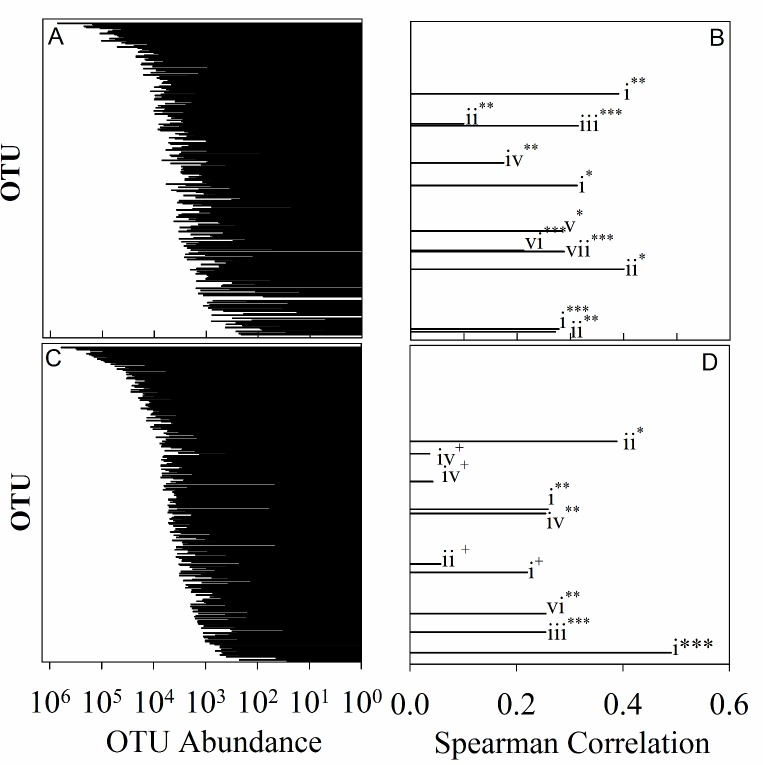
Fig 5. OTU abundance and contribution to variation in viral abundance and production.
Plots comparing rank order abundance for individual OTUs and contribution to the proportion of variation in virus abundance and production rates that each OTU contributes. Pairwise data are presented, rank order; contribution to virus dynamics, winter (A; B) and summer (C; D), respectively. Phyla indicated as follows: Chloroplast (i), Proteobacteria (ii), Cyanobacteria (iii), Planctomycetes (iv), Firmicutes (v), Unclassified bacteria (vi), Bacteroidetes (vii). Statistical significance indicated as follows: * = 0.001–0.01, ** = 0.01–0.05, *** = 0.05–0.1, + = > 0.1

