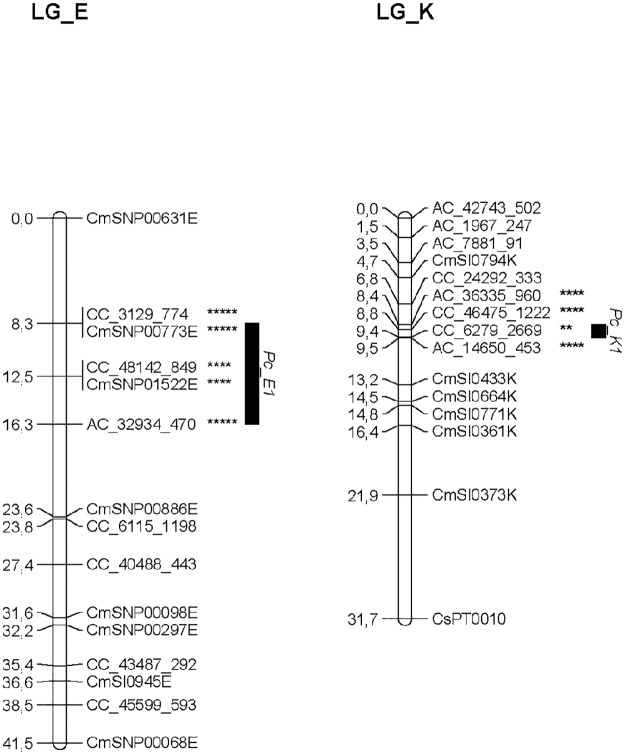
Fig 2. QTLs detected on the linkage groups of the C. sativa x C. crenata consensus genetic map by multiple QTL mapping (MQM) for P. cinnamomi resistance.
QTLs are represented by black boxes. Asterisks represents the significance levels obtained by Kruskal-Wallis test: ** = 0.05, **** = 0.005 and ***** = 0.001.

