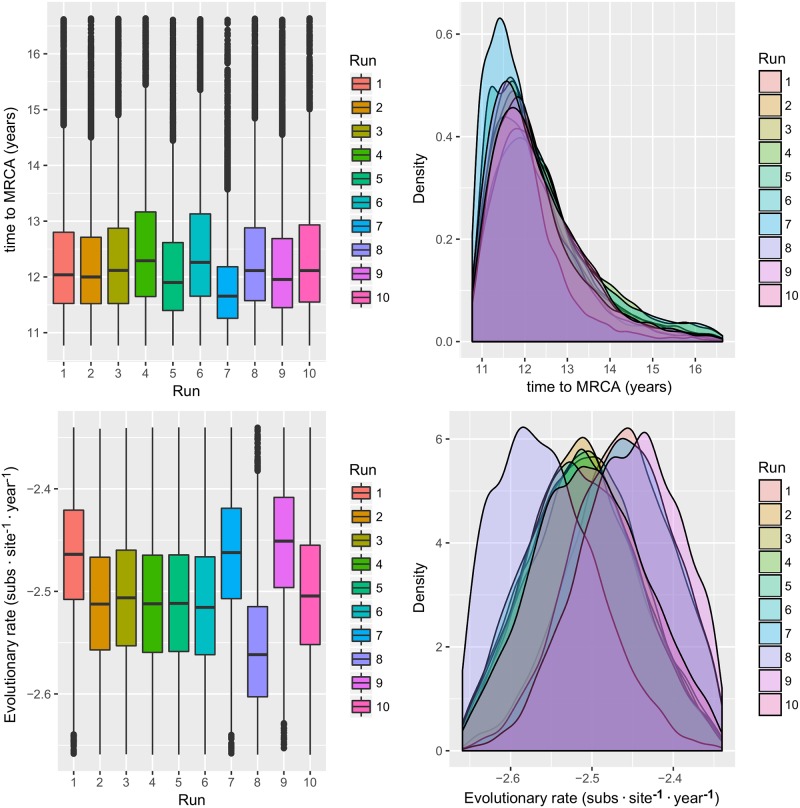
Fig 4. Italian QX genotype MRCA and evolutionary rate.
Upper figure: Boxplot (left) and Densityplot of the MRCA posterior probability. Lower figure: Boxplot (left) and Densityplot of the mean evolutionary rate (expressed in base-10 logarithm) posterior probability. Results have been estimated performing ten independent runs based on sequences randomly sampled from the Italian database. The 95HPD intervals are reported for both figures.

