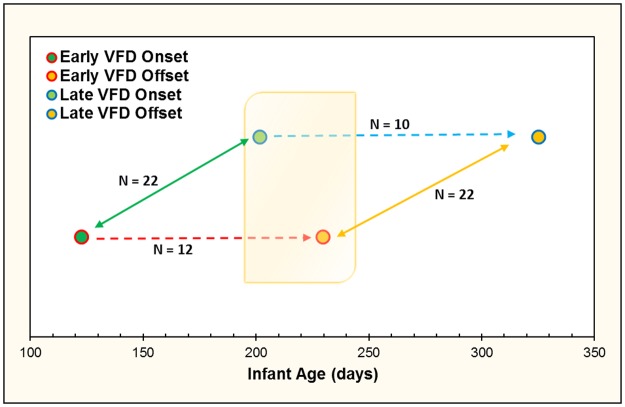
Fig 1. Representation of study design with staggered onset of VFD exposure based on infant age allowing for cross-sectional data analysis.
The shaded orange box represents the overlapping period of VFD rearing procedure that allowed for cross-sectional analyses, where the early onset group is entering the final phase of VFD, and late onset group is entering the initial phase of VFD. Blue and red dashed lines represent 16-week VFD phase. Bidirectional green and yellow lines represent VFD onset and offset for both groups, respectively. Mean infant ages at each interval follow: Early Onset [mean (SD) = 122.60 (37.70 days), N = 12]; Early Offset [229.70 (39.80)]; Late Onset [201.60 (22.72), N = 10]; Late Offset [325.20 (22.72)].

