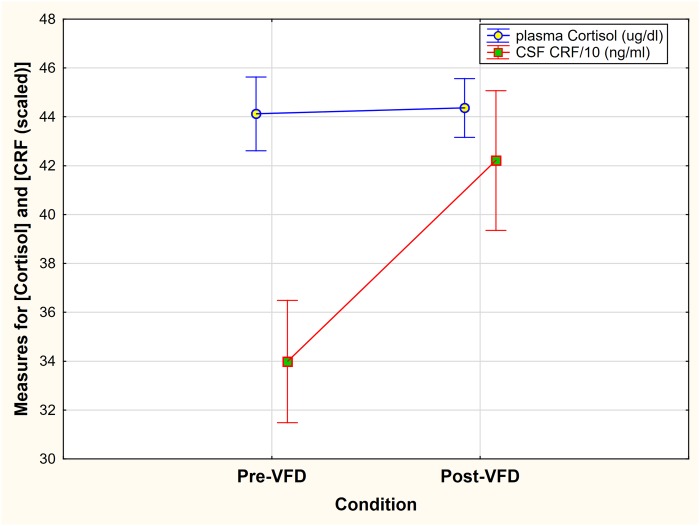
Fig 2. Group mean changes of CSF CRF concentrations and plasma Cortisol concentrations pre- and post-VFD exposure.
ANOVA-RM revealed a Measure*Condition effect [F(1,21) = 4.74, p = 0.04]. CSF CRF was scaled by a factor of 0.1 to approximate cortisol unit range. A significant increase in CRF group mean change and no group mean change in cortisol after VFD exposure was observed. Vertical bars denote standard errors.

