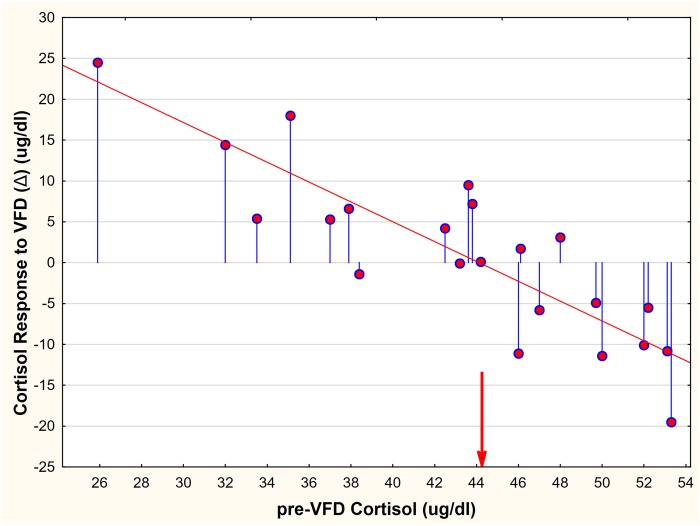
Fig 3. The relationship between maternal Pre-VFD cortisol and Δ cortisol (Post minus Pre-VFD) in response to maternal variable foraging demand.
The red arrow indicates the maternal pre-VFD and post-VFD plasma cortisol mean (44.36) which was unchanged despite exposure to VFD. The blue lines represent distance from no change (Δ = 0). The red line represents the regression line [r = -0.84, p = 0.0001, n = 22).

