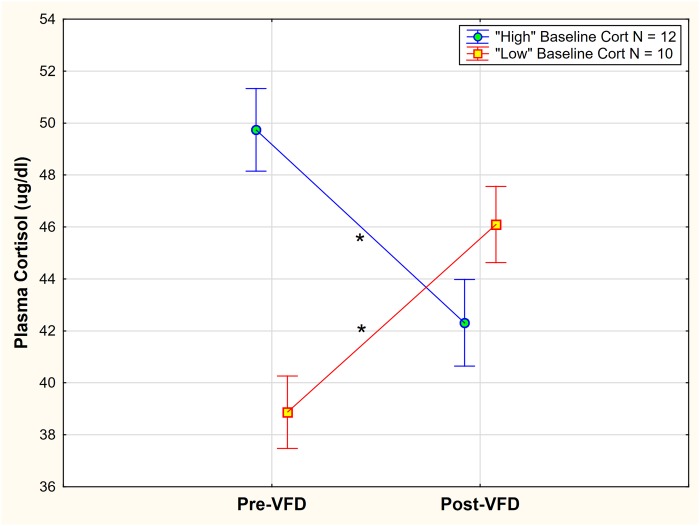
Fig 4. “High” versus “Low” baseline cortisol grouping and effects on plasma cortisol change in response to VFD exposure.
A significant pre-VFD cortisol grouping x repeated measures interactive effect was noted [F(1,20) = 20.36; p = 0.0002, partial η2 = 0.54, 3.8 x greater than a large effect size] such that the “high” pre-VFD cortisol group exhibited cortisol decreases whereas the “low” cortisol VFD group showed cortisol increases. Vertical bars indicate ± standard errors. * indicates NK posthoc testing with p < 0.05.

