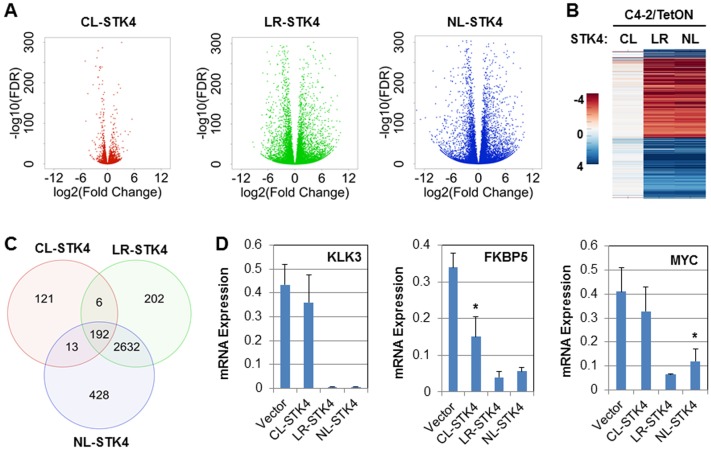
Fig 3. Overview of the RNAseq data and the validation.
(A) Volcano plots of DE genes from the DESeq2 analysis. (B) Heatmap of DE genes using fold-change values in all three STK4 conditions (C) Venn diagram of DE genes in C4-2/CL-STK4, C4-2/LR-STK4, and C4-2/NL-STK4 cells. (D) Quantitative RT-PCR analysis of select DE genes, *P < 0.01. Data are representation of the two independent experiments in duplicates.

