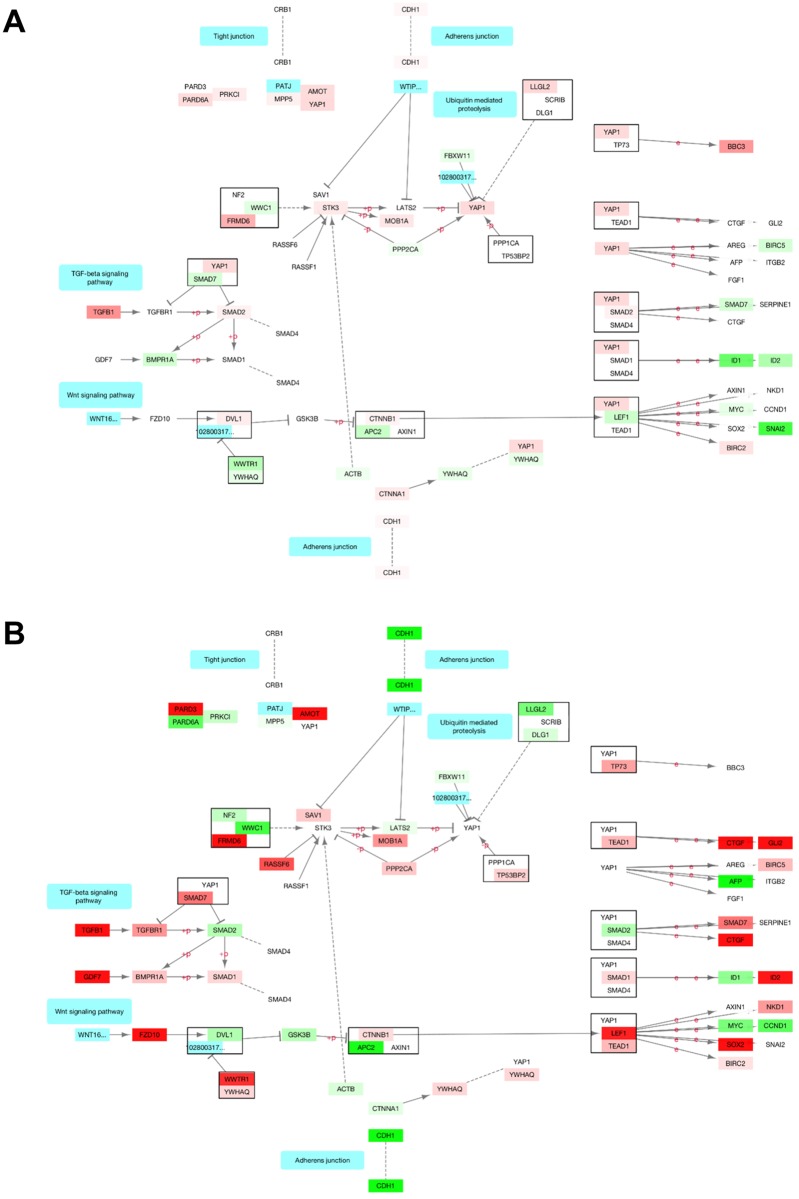
Fig 6. KEGG Hippo signaling pathway.
Each gene is colored by gene expression fold change in (A) CL-STK4 (B) NL-STK4 conditions using Cytoscape. Red: Upregulated, green: downregulated, white: not differentially expressed. Edge labels “e”: expression interaction, “+p”: phosphorylation, “-p”: dephosphorylation.

