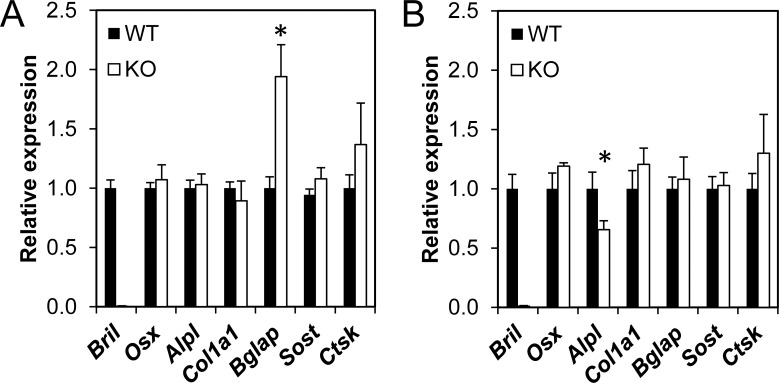
Fig 7. RT-qPCR gene expression monitoring in humeri.
Total RNA was extracted from humeri of 6w (A) and 3m (B) WT and KO littermates. RT-qPCR analysis of mRNAs encoding listed genes was performed with respective Taqman probes. Expression levels were normalized to β-actin and data are plotted relative to WT values for each gene. Values represent mean ± SEM (n = 6).

