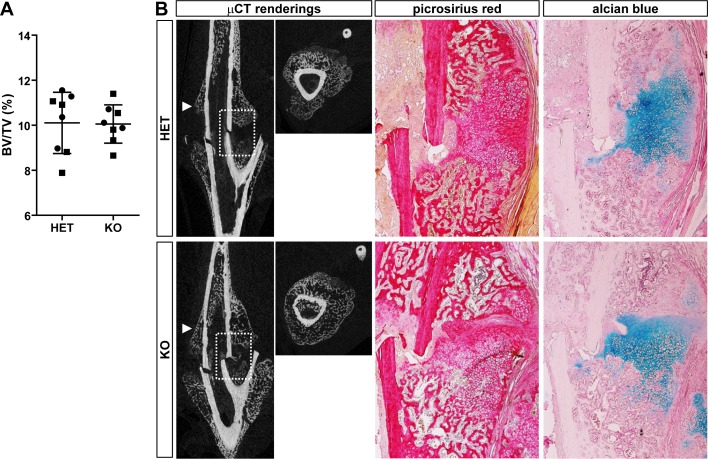
Fig 9. Rodded fracture repair experiment conducted on HET and KO mice at 4m of age.
A) Quantitative μCT measurements of the callus area 14-days after a mid-tibial fracture in males and females HET and KO (n = 8 per genotype; ■ males; ● females). The BT/TV percentage was determined using a fixed volume as described in materials and methods. Bars represent mean ± SD. No differences in the BV/TV of the fracture callus were detected between the two groups. B) At left, representative 2-D μCT renderings for the YZ longitudinal and YX trans-axial (pointing arrowhead) views for the HET (top) and KO (bottom). At right, representative histological images corresponding to the boxed area shown in the μCT. Picrosirius red and alcian blue stain for collagen (red) and cartilage proteoglycan (blue) network, respectively. Alcian blue counterstain is nuclear fast red.

