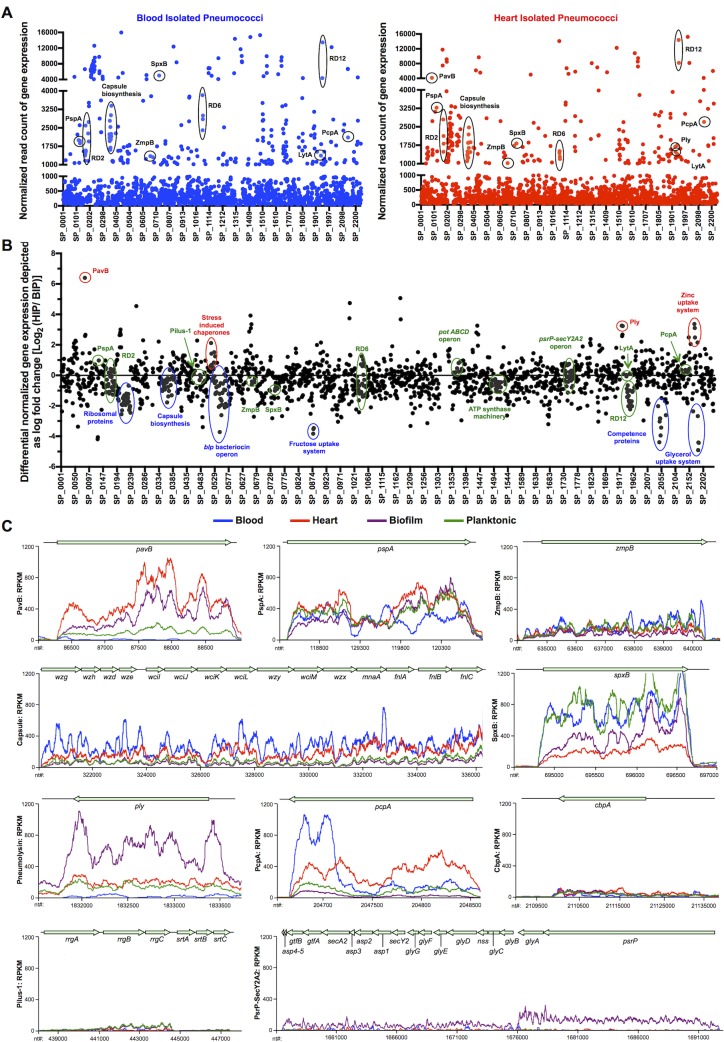
Fig 4. Comparative gene expression analysis of HIP, BIP and pneumococci from in vitro biofilm and planktonic pneumococci.
(A) Dot plot representation of the whole genome transcriptomic profile for blood- isolated pneumococci, BIP (blue) and heart-isolated pneumococci, HIP (red) showing the average normalized number of RNA-seq reads identified, i.e. gene expression levels mapping to each TIGR4 gene within the blood and the heart. Y-axis denotes normalized expression levels (RPKMs) whereas X-axis denotes location of the genes on the TIGR4 chromosome. Established virulence determinants with expression levels >1000 RNA-seq reads (i.e. corresponding to top 10% of genes with highest expression levels) for BIP and HIP are indicated. (B) Dot plot representation of the differential gene expression profile for BIP and HIP spanning the TIGR4 genome. The fold changes are depicted as Log2(HIP/BIP). Y-axis denotes log fold changes in gene expression levels whereas X-axis denotes location of the genes on the TIGR4 chromosome. Important differentially up-regulated pneumococcal genes for BIP and HIP are indicated in blue and red respectively. Genes clustered near the X-axis are consistently expressed. (C) Curve plot representation of gene expression levels for genes encoding designated pneumococcal virulence determinants in the BIP, HIP, in vitro biofilm-, and in vitro planktonic- TIGR4 samples. Y-axis denotes normalized expression levels (i.e. RPKMs) whereas X-axis denotes individual nucleotide location (nt coordinates) on the TIGR4 chromosome. Two pooled BIP samples (5 mice per sample), three HIP samples, three in vitro biofilms and three in vitro planktonic pneumococci samples were tested.

